![]()
Volume represents the activity of traders and investors. Each unit of volume in the market reflects the action of two persons: One trader sells a share and another buys a share, or one buys a contract and another sells a contract. Daily volume is the number of contracts or shares traded in one day.
Traders usually plot volume as a histogram-vertical bars whose height reflects each day's volume (Figure 32-1). They usually draw it underneath prices. Changes in volume show how bulls and bears react to price swings. Changes in volume provide clues as to whether trends are likely to continue or to reverse.
Some traders ignore volume. They think that prices already reflect all information known to the market. They say, "You get paid on price and not on volume." Professionals, on the other hand, know that analyzing volume can help them understand markets deeper and trade better.
There are three ways to measure volume:
The actual number of shares or contracts
traded. For example, the
New York Stock Exchange reports volume this way. This is the most
objective way of measuring volume.
The
number of trades that took place. For example, the London Stock
Exchange reports volume this way. This method is less objective
because it does not distinguish between a 100-share trade and a 5000-
share trade.
To interpret volume, you need tc/link) i^changes with^changes in prices?)
A. An increase in volume during an uptrend calls for
higher prices
ahead. Buy or add to longs.
B. Prices
jump on more than double the average volume. It is a sign of
a potential blow-off mnvp/fjghlpn stops on
C. Prices rally near the level of their previous peak, but volume is much lower. This bearish divergence signals a top-TSeTPlongs and "Th
D. Prices collapse on panicky volume. Such climax bottoms are usually retested^Tighten stops on short positions^
E. Silver falls to a new low, but volume is lower
than it was at point
D-a typical retest of a climax
bottom/Cover shorts and go longi
![]() F. A new high in price is accompanied by an increase
in volume, sim
F. A new high in price is accompanied by an increase
in volume, sim
ilar to what happened at point A.
Continue to hold long positions.
![]() 3. Tick
volume is the number of price changes during a selected time, such as 10
minutes or an hour. It is called tick volume because most changes
equal 1 tick. Most futures exchanges in the
3. Tick
volume is the number of price changes during a selected time, such as 10
minutes or an hour. It is called tick volume because most changes
equal 1 tick. Most futures exchanges in the
Volume reflects the activity of buyers and sellers. If you compare volume between two markets, it will show which one is more active or liquid. You are likely to suffer less slippage in liquid markets than in thin, low-volume markets.
Crowd Psychology
Volume reflects the degree of financial and emotional involvement, as well as pain, of market participants. A trade begins with a financial commitment by two persons. The decision to buy or sell may be rational, but the act of buying or selling creates an emotional commitment in most people. Buyers and sellers crave to be right. They scream at the market, pray, or use lucky talismans. Volume reflects the degree of emotional involvement among traders.
Each tick takes money away from losers and gives it to winners. When prices rise, longs make money and shorts lose. When prices fall, shorts gain and longs lose. Winners feel happy 727e413h and elated, while losers feel depressed and angry. Whenever prices move, about half the traders are hurting. When prices rise, bears are in pain, and when prices fall, bulls suffer. The greater the increase in volume, the more pain in the market.
Traders react to losses like frogs to hot water. If you throw a frog into a boiling kettle, it will jump in response to sudden pain, but if you put a frog into cool water and heat it slowly, you can boil it alive. If a sudden price change hits traders, they jump from pain and liquidate losing positions. The same losers can be very patient if their losses increase gradually.
You can lose a great deal of money in a sleepy market, such as corn, where a one-cent move costs only $50. If corn goes against you just a few cents a day, the pain is easy to tolerate. If you hang on, those pennies can add up to thousands of dollars in losses. Sharp moves, on the other hand, make losers cut their losses in a panic. Once weak hands get shaken out, the market is ready to reverse. Trends can last for a long time on moderate volume but can expire after a burst of volume.
Who buys from a trader who sells his losing long position? It may be a short seller taking profits and covering shorts. It may be a bargain hunter who steps in because prices are "too low." That bottom-picker assumes the position of a loser who washed out-and he either catches the bottom or becomes the new loser.
Who sells to a trader who buys to cover his losing short position? It may be a savvy investor who takes profits on his long position. It also may be a top-picker who sells short because he thinks that prices are "too high." He assumes the position of a loser who covered his shorts, and only the future will tell whether he is right or wrong.
When shorts give up during a rally, they buy to cover and push the market higher. Prices rise, flush out even more shorts, and the rally feeds on itself. When longs give up during a decline, they sell and push the market lower. Falling prices flush out even more longs, and the decline feeds on itself. Losers who give up propel trends. A trend that moves on steady volume is likely to continue. Steady volume shows that new losers replace those who wash out. Trends need a fresh supply of losers the way builders of the ancient pyramids needed a fresh supply of slaves.
Falling volume shows that the supply of losers is running low and a trend is ready to reverse. It happens after enough losers catch on to how wrong they are. Old losers keep bailing out, but fewer new losers come in. Falling volume gives a sign that the trend is about to reverse.
A burst of extremely high volume also gives a signal that a trend is nearing its end. It shows that masses of losers are bailing out. You can probably recall holding a losing trade longer than you should have. Once the pain becomes intolerable and you get out, the trend reverses and the market goes the way you expected, but without you! This happens time and again because most amateurs react to stress similarly and bail out at about the same time. Professionals do not hang in while the market beats them up. They close out losing trades fast and reverse or wait on the sidelines, ready to re-enter.
Volume usually stays low in trading ranges because there is relatively little pain. People feel comfortable with small price changes, and trendless markets seem to drag on forever. A breakout is often marked by a dramatic increase in volume because losers run for the exits. A breakout on low volume shows little emotional commitment to a new trend. It indicates that prices are likely to return into their trading range.
Rising volume during a rally shows that more buyers and short sellers are pouring in. Buyers are eager to buy even if they have to pay up, and shorts are eager to sell to them. Rising volume shows that losers who leave are being replaced by a new crop of losers.
When volume shrinks during a rally, it shows that bulls are becoming less eager, while bears are no longer running for cover. The intelligent bears have left long ago, followed by weak bears who could not take the pain. Falling volume shows that fuel is being removed from the uptrend and it is ready to reverse.
When volume dries up during a decline, it shows that bears are less eager to sell short, while bulls are no longer running for the exits. The intelligent bulls have sold long ago, and the weak bulls have been shaken out. Falling volume shows that the remaining bulls have a higher level of pain tolerance. Perhaps they have deeper pockets or bought later in the decline, or both. Falling volume identifies an area in which a downtrend is likely to reverse.
This reasoning applies to long and short timeframes. As a rule of thumb, if today's volume is higher than yesterday's volume, then today's trend is likely to continue.
Trading Rules
The terms "high volume" and "low volume" are relative. What is low for IBM is high for Apple Computer, while what is low for gold is high for platinum, and so on. As a rule of thumb, "high volume" for any given market is at least 25 percent above average for the past two weeks, and "low volume" is at least 25 percent below average.
High volume confirms trends. If prices rise to a new peak and volume reaches a new high, then prices are likely to retest or exceed that peak.
If the market falls to a new low and the volume reaches a new high, that bottom is likely to be retested or exceeded. A "climax bottom" is almost always retested on low volume, offering an excellent buying opportunity.
If volume shrinks while a trend continues, that trend is ripe for a rever sal. When a market rises to a new peak on lower volume than its pre vious peak, look for a shorting opportunity. This technique does not work as well at market bottoms because a decline can persist on low volume. There is a saying on Wall Street: "It takes buying to put stocks up, but they can fall of their own weight."
Watch volume during reactions against the trend. When an uptrend is punctuated by a decline, volume often picks up in a flurry of profit taking. When the dip continues but volume shrinks, it shows that bulls are no longer running or that selling pressure is spent. When volume dries up, it shows that the reaction is nearing an end and the uptrend is ready to resume. This identifies a good buying opportunity. Major downtrends are often punctuated by rallies which begin on heavy volume. Once weak bears have been flushed out, volume shrinks and gives a signal to sell short.
More on Volume
You can use a moving average to define the trend of volume. The slope of a 5-day exponential moving average of volume can define volume's trend. You can also draw trendlines of volume and watch for their breakouts (see Section 21). Volume breakouts confirm price breakouts.
Volume-based indicators provide more precise timing signals than volume alone. Traders' Index, Herrick Payoff Index, Force Index, and others include volume data (see Chapters 6 and 8).
Traders can use several technical indicators to help them analyze volume. Some traders track a 5-day exponential moving average of volume. Its slope identifies the trend of volume (see Sections 25 and 32). Others use On-Balance Volume and Accumulation/Distribution.
On-Balance Volume
On-Balance Volume (OBV) is an indicator designed by Joseph Granville and described in his book, New Strategy of Daily Stock Market Timing. Granville used OBV as a leading indicator of the stock market, but other analysts have applied it to the futures markets.
OBV is a running total of volume. It rises or falls each day, depending on whether prices close higher or lower than on the previous day. When a stock closes higher, it shows that bulls won the day's battle; its volume on that day is added to OBV. When a stock closes lower, it shows that bears won the day, and that day's volume is subtracted from OBV. If prices close unchanged, OBV stays unchanged.
On-Balance Volume often rises or falls before prices - it acts as a leading indicator. As Granville put it, "Volume is the steam that makes the choo-choo go."
Crowd Psychology
Prices represent the consensus of value, while volume represents the emotions of market participants. It reflects the intensity of traders' financial and emotional commitments, as well as pain among losers (see Section 32). OBV is a running total of volume. It tracks changes in traders' involvement in the market and the intensity of their pain.
A new high in OBV shows that bulls are powerful, bears are hurting, and prices are likely to rise. A new low in OBV shows that bears are powerful, bulls are hurting, and prices are likely to fall. When the pattern of OBV deviates from the pattern of prices, it shows that mass emotions are not in gear with mass consensus. A crowd is more likely to follow its heart than its mind. This is why changes in volume often precede changes in prices.
Trading Signals
The patterns of OBV tops and bottoms are more important than the absolute levels of this indicator. Those levels depend on when you start to calculate On-Balance Volume. When OBV rises or falls together with prices, the trend is confirmed. If prices reach a new high and OBV reaches a new high, the uptrend is likely to continue. If prices reach a new low and OBV falls to a new low, the downtrend is likely to continue. It is safer to trade in the direction of a trend that is confirmed by OBV (Figure 33-1).
When OBV reaches a new high, it confirms the power of bulls, indicates that prices are likely to rise even higher, and gives a buy signal. When OBV reaches a new low, it confirms the power of bears, calls for lower prices ahead, and gives a signal to sell short.
OBV give the strongest buy and sell signals when it diverges from process. If prices rally, sell off, and then rise to a new high, but OBV rallies to a lower high, it creates a bearish divergence and gives a strong sell signal. If prices decline, rebound, and then fall to a new low, but OBV falls to a more shallow bottom, it traces a bullish divergence and gives a strong buy signal. Long-term divergences are more important than short-term divergences. Divergences that develop over the course of several weeks give stronger signals than those that last only a few days.
3. When prices are in a trading range and OBV breaks out to a new high, it gives a buy signal. When prices are in a trading range and OBV breaks down and falls to a new low, it gives a signal to sell short.
More on OBV
One of the reasons for Granville's success in his heyday (see Section 6) was that he combined OBV with two other indicators - the Net Field Trend indicator and the Climax indicator. Granville calculated OBV for each stock in the Dow Jones Industrial Average and rated its OBV pattern as rising, falling, or neutral. He called that a Net Field Trend of a stock: It could be +1, -1, or 0. Climax indicator was a sum of the Net Field Trends of all 30 Dow stocks.
When the stock market rallied and the Climax indicator reached a new high, it confirmed strength and gave a buy signal. If the stock market rallied but the Climax indicator made a lower top, it gave a sell signal.
You can view the Dow Jones Industrial Average as a team of 30 horses pulling the market wagon. The Climax indicator shows how many horses are pulling uphill, downhill, or standing still. If 24 out of 30 horses pull up, 1 down and 5 are resting, then the market wagon is likely to move up. If 9 horses pull up, 7 pull down, and 14 are resting, then the wagon is ready to roll downhill.
OBV, the Net Field Trend indicator, and the Climax indicator can be easily programmed on a computer. It would be worthwhile to apply them to a database which includes all stocks of the S&P 500 index. That may produce good signals for trading S&P 500 futures or options.
Accumulation/Distribution
This indicator was developed by Larry Williams and described in his 1972 book, How I Made a Million Dollars. It was designed as a leading indicator for stocks, but several analysts have applied it to futures. The unique feature of Accumulation/Distribution (A/D) is that it tracks the relationship between opening and closing prices, along with volume.
If prices close higher than they opened, then bulls won the day and A/D is positiveTlf prices close lower than they opened, then the bears won and A/D is negative. If price's close where they opened, then nobody won and A/D is zero. A" running total of each day's A/D creates a cumulative Accumulation/Distribution indicator.
A/D credits bulls or bears with only a fraction of each day's volume. That fraction depends on the day's range and the distance from opening to closing price. The greater the spread between opening and closing price relative to daily range, the greater the change in Accumulation/Distribution
Close - Open
A/D = Volume
High - Low
For example, if the distance from today's high to low is 5 points but the distance from the open to the close is 2 points, then only 2/5 of today's volume is credited to the winning camp. The pattern of A/D highs and lows is more important than its absolute level, which depends on the starting date.
When the market rises, most people focus on new highs. But if prices open higher and close lower, then A/D, which tracks their relationship, turns down. It warns that the uptrend is weaker than it appears. If A/D ticks up while prices are down, it shows that bulls are gaining strength.
Crowd Behavior
Opening and closing prices are among the most important prices of the day. The opening price reflects all the pressures that have gathered while the market was closed. Openings are often dominated by amateurs who read their newspapers in the evening and trade in the morning.
Professional traders are active throughout the day. They often trade against the amateurs. As the day goes on, waves of buying and selling by amateurs and slow-moving institutions gradually subside. Professionals usually dominate the markets at closing time. Closing prices are especially important because the settlement of trading accounts depends on them.
A/D tracks the outcomes of daily battles between amateurs and professionals. It ticks up when prices close higher than they opened-when professionals are more bullish than amateurs. It ticks down when prices close lower than they opened -when professionals are more bearish than amateurs. It pays to bet with the professionals and against the amateurs.
Trading Rules
When the market opens low and closes high, it moves from weakness to strength. A/D then rises and shows that market professionals are more bullish than amateurs. This means that the market is likely to move higher the following day. When A/D falls, it shows that market professionals are more bearish than amateurs. When the market moves from strength to weakness, it is likely to reach a lower low the following day.
The best trading signals are given by divergences between A/D and prices.
1. If prices rally to a new high but A/D reaches a lower peak, it gives a signal to sell short. This bearish divergence shows that market professionals are selling into the rally (Figure 33-2).
2. A bullish divergence occurs when prices fall to a new low but A/D stops at a higher low than during its previous decline. It shows that market professionals are using the decline for buying, and a rally is coming.
More on Accumulation/Distribution
When you go long or short, following a divergence between A/D and price, remember that even market professionals can go wrong. Use stops and protect yourself by following the Hound of the Baskervilles rule (see Section
Volume Accumulator, designed by Marc Chaikin, is an indicator very similar to A/D. Volume Accumulator uses a mean price for the day instead of the opening price. It is especially useful for those analysts who do not have access to opening prices. Its trading signals and rules are similar to Accumulation/Distribution.
There are important parallels between A/D and Japanese Candlestick charts. Both focus on the differences between opening and closing prices. A/D goes further than candlesticks by taking volume into account.
Open interest is the number of contracts held by buyers or owed by short sellers in a given market on a given day. It shows the number of existing contracts. Open interest equals either a total long or a total short position.
Stock market shares are traded for as long as a company stays in business as a separate unit. Futures and options traders, on the other hand, deal in contracts for a future delivery that expire at a set time.
A futures or options buyer who wants to accept delivery and a seller who wants to deliver have to wait until the first notice day. This waiting period ensures that the numbers of contracts that are long and short are always equal.
In any case, very few futures and options traders plan to deliver or to accept delivery. Most traders close out their positions before the first notice day.
Open interest rises or falls depending on whether new traders enter the market or old traders exit it. Open interest rises only when a new buyer and a new seller enter the market. Their trade creates a new contract. For example, if open interest in April COMEX gold is 8500 contracts, then 8500 contracts are held by bulls and 8500 contracts are owed by short sellers at the close of that day. If open interest rises to 8600, it means that the net of 100 new contracts have been bought and sold short.
Open interest falls when a trader who is long trades with someone who is short. When both of them close out their positions, open interest falls by one contract because one contract disappears. If a new bull buys from an old bull who is getting out of his long position, open interest remains unchanged: Open interest also does not change when a new bear sells to an old bear who needs to buy because he is closing out his short position.
![]() Buyer Seller Open Interest
Buyer Seller Open Interest
New buyer New seller Increases
New buyer Former buyer sells Unchanged
Former seller buys to cover New seller Unchanged
Former seller buys to cover Former buyer sells Decreases
Most futures and options exchanges release open interest data one day later than prices. Some exchanges provide phone numbers to call for preliminary figures on open interest.
Technicians usually plot open interest as a line below price bars (Figure 34-1). Some chart services also plot average open interest for the past several years. Open interest gives important messages when it deviates from its seasonal norm. Open interest varies from season to season in many markets because of massive hedging by commercial interests at different stages in production cycles.
Open interest in currency futures tends to drop four times a year, at the time of a contract rollover. If open interest does not drop during a rollover, it shows a strong commitment among traders to the existing trend, which is likely to accelerate.
Crowd Psychology
It takes one bull and one bear to create a futures or options contract. A bull buys a contract if he is convinced that prices are going higher. A bear sells short a contract if he is convinced that prices are going lower. When the two trade, open interest rises by one contract. A single trade between one bull and one bear is unlikely to move the markets. But when thousands of traders make their trades, they propel or reverse market trends.
Open interest reflects the intensity of conflict between bulls and bears. It reflects the willingness of longs to maintain long positions and the willingness of shorts to maintain short positions. When bulls and bears do not expect the market to move in their favor, they close out their positions and open interest shrinks.
There are two people on opposite sides of every trade. One of them gets hurt when prices change. If prices rally, bears get hurt. If prices fall, bulls get hurt. As long as the losers hope, they hang on, and open interest does not change.
A rise in open interest shows that a crowd of confident bulls is facing down a crowd of equally confident bears. It points to a growing disagreement between the two camps. One group is sure to lose, but as long as potential losers keep pouring in, the trend will continue. These ideas have been clearly put forth in L. Dee Belveal's classic book, Charting Commodity Market Price Behavior.
Bulls
and bears keep adding to their positions as long as they strongly dis-
Open interest (Ol) reflects the number of all short or long positions in any futures or options market. Open interest depends on the intensity of conflict between bulls and bears.
Rising Ol shows that the conflict between bulls and bears is becoming more intense and confirms the existing trend. Rising Ol during uptrends shows it is safe to add to long positions (A and D). Flat Ol shows that fewer losers are entering the market. This means that a mature trend is nearing its end and it is time to take profits or tighten stops (B and E). Falling Ol shows that losers are leaving the market and winners are cashing in-that a trend is nearing its end. A fire cannot continue when fuel is withdrawn, and a sharp drop in Ol during a trend signals that a reversal is near (C and F).
At the right edge of the chart, cocoa prices have stabilized after falling in October and open interest is flat. It shows that the decline in cocoa has shaken out weak bulls and the uptrend is ready to resume. It is time to go long, with a protective stop below the recent lows.
![]() agree about
the future course of prices. It takes conviction and disagreement to maintain a
trend. Rising open interest shows that the supply of losers is growing and the
current trend is likely to persist. If open interest increases during an
uptrend, it shows that longs are buying while bears are shorting because
they believe that the market is too high. They are likely to run for cover when
the uptrend puts a squeeze on them - and their buying will propel prices
higher.
agree about
the future course of prices. It takes conviction and disagreement to maintain a
trend. Rising open interest shows that the supply of losers is growing and the
current trend is likely to persist. If open interest increases during an
uptrend, it shows that longs are buying while bears are shorting because
they believe that the market is too high. They are likely to run for cover when
the uptrend puts a squeeze on them - and their buying will propel prices
higher.
If open interest rises during a downtrend, it shows that shorts are aggressively selling while bottom-pickers are buying. Those bargain hunters are likely to bail out when falling prices hurt them, and their selling will push prices even lower. An increase in open interest gives a green light to the existing trend.
When a bull is convinced that prices are going higher and decides to buy, but a bear is afraid to sell short, that bull can buy only from another bull who bought earlier and now wants to get out. Their trade creates no new contract, and open interest stays unchanged. When open interest stays flat during a rally, it shows that the supply of losers has stopped growing.
When a bear is convinced that prices are going lower, he wants to sell short. If a bull is afraid to buy from him, that bear can only sell to another bear who shorted earlier and now wants to cover and leave. Their trade creates no new contract, and open interest does not change. When open interest stays flat during a decline, it shows that the supply of bottom-pickers is not growing. Whenever open interest flattens out, it flashes a yellow light-a warning that the trend is aging and the best gains are probably behind.
Falling open interest shows that losers are bailing out while winners are taking profits. When their disagreement decreases, the trend is ripe for a reversal. Open interest falls when losers abandon hope and get out of the market without being replaced by new losers. When a bull decides to get out of his long position and a bear decides to cover his short position, the two may trade with one another. When they do, a contract disappears, and open interest shrinks by one contract. Falling open interest shows that winners are cashing in and losers are giving up hope. It flashes a red light-it signals the end of a trend.
Trading Rules
A 10 percent change in open interest deserves serious attention, while a 25 percent change often gives major trading messages. The meaning of rising, falling, or flat open interest depends on whether prices are rallying, falling, or flat at the time of change in open interest.
When open interest rises during a rally, it confirms the uptrend and gives a signal that it is safe to add to long positions. It shows that more short sellers are coming into the market. When they bail out, their short covering is likely to push the rally higher.
When open interest rises while prices fall, it shows that bottom-pickers are active in the market. It is safe to sell short because these bargain hunters are likely to push prices lower when they throw in the towel.
When open interest rises while prices are in a trading range, it is a bearish sign. Commercial hedgers are more likely to sell short than speculators. A sharp increase in open interest while prices are flat shows that savvy hedgers are probably shorting the market.
When open interest falls sharply while prices are in a trading range, it identifies short covering by major commercial interests and gives a buy signal. When commercials start covering shorts, they show that they expect the market to rise.
When open interest falls during a rally, it shows that both winners and losers are getting "cold feet." Longs are taking their profits, and shorts are covering. Markets discount the future, and a trend that is accepted by the majority is ready to reverse. If open interest falls during a rally, sell and get ready to sell short.
When open interest falls during a decline, it shows that shorts are covering and buyers are taking their losses and bailing out. If open interest falls during a slide, cover shorts and get ready to buy.
When open interest goes flat during a rally, it warns that the uptrend is getting old and the best gains have already been made. This gives you a signal to tighten stops on long positions and avoid new buying. When open interest goes flat during a decline, it warns you that the downtrend is mature and it is best to tighten stops on short positions. Flat open interest in a trading range does not contribute any new information.
More on Open Interest
The higher the open interest, the more active the market, and the less slippage you risk while getting in and out of positions. Short-term traders should focus on the markets with the highest open interest. In the futures markets, it pays to trade the delivery months with the highest open interest.
Tracking Commitments of Traders reports can help you find out whether new buying or selling is primarily done by small or large speculators or by hedgers (see Chapter 7).
Very few technical indicators use open interest. The Herrick Payoff Index is the best-known indicator that utilizes it.
The Herrick Payoff Index (HPI)
is an indicator developed by John Herrick, a technical market analyst from
The Herrick Payoff Index helps detect accumulation and distribution. Most indicators measure only prices, some measure volume, but HPI tracks open interest as well as prices and volume. HPI confirms valid trends and helps catch their reversals.
How to Construct HPI
The Herrick Payoff Index may be calculated using several types of daily data. You may use a single contract with its own price, volume, and open interest. It is more practical to combine volume and open interest from all contracts and apply them to the prices of the most active delivery month.
HPI uses daily high and low prices, volume, and open interest. It requires data for at least three weeks before it begins producing meaningful numbers. Its complex formula makes using a computer almost a necessity (see worksheet, Figure 35-1).
Traders
can apply HPI only to daily data and not to weekly or intraday data. There
is no such thing as weekly open interest. Weekly volume can be obtained by
adding up daily volume for five days, but open interest cannot be added
up.
The Herrick Payoff Index measures mean prices rather than closing prices. Daily mean prices represent the average consensus of value for the day.
Volume represents the degree of financial commitment in a given market. When volume increases, the absolute value of HPI for that day increases.
Daily changes in open interest represent the flow of funds into and out of the market. Rising open interest is bullish in an uptrend and bearish in a downtrend. Falling open interest is bearish in an uptrend and bullish in a downtrend. Flat open interest is essentially neutral.
Trading Rules
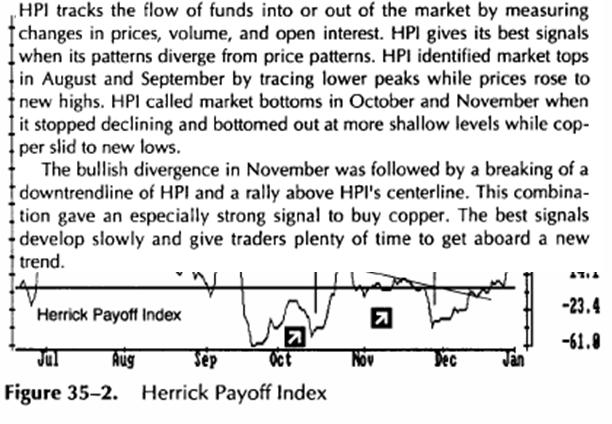
The Herrick Payoff Index gives several types of trading signals, listed here in the order of importance. Divergences between HPI and prices identify some of the best trading opportunities (Figure 35-2). When HPI breaks its trendline, it gives an early warning that a price trendline is likely to be broken. When HPI crosses its centerline, it confirms new price trends.
When prices fall to a new low but HPI makes a higher bottom than during the previous decline, it creates a bullish divergence and gives a buy signal. When HPI turns up from its second bottom, buy and place a protective stop below the latest price low.
A bearish divergence occurs when prices rally to a new high but HPI makes a lower top. The signal to sell short is flashed when HPI turns down from its second top. Place a protective stop above the latest high price.
Important divergences develop over the course of several weeks. A divergence that takes two months to develop is more powerful than the one in which two weeks passed between the tops or bottoms. Pay attention to the differences in the height of the adjacent HPI tops or bottoms. If the first top or bottom is far away from the centerline and the second top or bottom is near that line, that divergence is likely to lead to a greater move.
Bullish and bearish divergences of HPI often have long lead times. Once you have identified a potential turning point using an HPI divergence, lean on short-term oscillators for more precise timing. If a divergence between HPI and price aborts, and you get stopped out, watch closely-you may get an even better trading opportunity if a regular divergence turns into a triple bullish or triple bearish divergence. Triple bullish divergences consist of three lower bottoms in prices and three higher bottoms in HPI. Triple bearish divergences consist of three higher tops in prices and three lower tops in HPI. They occur at some of the major turning points in the markets.
HPI lends itself well to classical charting methods, especially trend lines. When trendlines of prices and HPI point in the same direction, they confirm trends. HPI often breaks its trendline before prices break theirs. When HPI breaks below its uptrend, it gives a sell signal. When it breaks above a downtrend, it gives a buy signal. Then it pays to either take profits or to tighten stops.
4. The position of HPI above or below its centerline shows whether bulls or bears dominate the market. When HPI is above its centerline, it shows that bulls are in control -it is better to be long. When HPI is below its centerline, it is better to be short. Bulls may buy or add to their long positions when HPI rises above its centerline. When HPI declines below its centerline, it confirms downtrends.
Most people conduct their lives as if they intend to live forever-with no review of the past, no real planning for the future, and minimal learning from past mistakes. Freud showed that the unconscious mind does not have a notion of time. Our deep-seated wishes remain largely unchanged throughout life.
When people join crowds, their behavior becomes even more primitive and impulsive than when they are alone. Crowds pay no attention to time even though they are affected by its passage. Individuals are ruled by the calendar and the clock, but crowds have no notion of time. Crowds act out their emotions as if they had all the time in the world.
Most traders focus only on changes in prices and pay little attention to time. This is just another sign of being caught up in mass mentality.
The awareness of time is a sign of civilization. A thinking person is aware of time, while someone who is acting impulsively is not. A market analyst who pays attention to time is aware of a dimension hidden from the market crowd.
Cycles
Long-term price cycles are a fact of economic
life. For example, the
Major cycles in agricultural commodities are due to fundamental production factors, coupled with the mass psychology of producers. For example, when livestock prices rise, farmers breed more animals. When those animals reach the market, prices fall and producers cut back. When the supply is absorbed, scarcity pushes prices up, breeders go to work again, and the bull/bear cycle repeats. This cycle is shorter in hogs than in cattle because pigs breed faster than cows.
Long-term cycles can help traders identify market tides. Instead, most traders get themselves in trouble by trying to use short-term cycles for precision timing and predicting minor turning points.
Price peaks and valleys on the charts often seem to follow in an orderly manner. Traders reach for a pencil and a ruler, measure distances between neighboring peaks, and project them into the future to forecast the next top. Then they measure distances between recent bottoms and extend them into the future to forecast the next low.
Cycles put
bread and butter on the tables of several experts who sell services
forecasting highs and lows. Few of them realize that what appears like a cycle on
the charts is often a figment of the imagination. If you analyze price data
using a mathematically rigorous program such as John Ehlers'
If you look at any river from the air, it appears to have cycles, swinging right and left. Every river meanders in its valley because water flows faster in its middle than near the shores, creating turbulences that force the river to turn.
Looking for
market cycles with a ruler and a pencil is like searching for water with a
divining rod. Profits from an occasional success are erased by many
losses due to unsound methods. If you are serious about trading with cycles, you
need a mathematical method for finding them, such as
Fourier
analysis searches for cycles in very large data samples, but
Indicator Seasons
A farmer sows in spring, harvests in late summer, and uses the fall to get ready for winter. There is a time to sow and a time to reap, a time to bet on a warm trend and a time to get ready for a cold spell. The concept of seasons can be applied to the financial markets. A trader can use a farmer's approach. He should look to buy in spring, sell in summer, go short in the fall, and cover in winter.
Martin
Pring developed the model of seasons for prices, but this concept works
even better with technical indicators. Indicator seasons show you where you
are in the market cycle. This simple but effective concept helps you buy
when prices are low and sell short when they are high. It tells you when an
indicator signal is likely to be strong or weak. It helps you stand apart from
the market crowd.
The
season of any indicator is defined by two factors: its slope and its position
above or below the centerline. For example, we can apply the concept of
indicator seasons to MACD-Histogram (see Section 26). We define the slope
of MACD-Histogram as the relationship between two neighboring bars. When
MACD-Histogram rises from below its centerline, it is spring; when it
rises above its centerline, it is summer; when it falls from above its
centerline, it is autumn; and when it falls below its centerline, it is winter.
Spring is the best season for going long, and autumn is the best season for
selling short (Figure 36-2).
![]()
When MACD-Histogram is below its centerline but its slope is rising, it is spring in the market. The weather is cool but turning warmer. Most traders expect the winter to return and are afraid to buy. Emotionally, it is hard to buy because the memories of a downtrend are still fresh. In fact, spring is the best time for buying, with the highest profit potential. Risk is low because a protective stop can be placed slightly below the market.
When MACD rises above its centerline, it is summer in the market - and most traders recognize the uptrend. It is emotionally easy to buy in summer because bulls have plenty of company. In fact, profit potential in summer is lower than in spring and risks are higher because stops have to be farther away from the market.
When MACD-Histogram is above its centerline but its slope turns down, it is autumn in the market. Few traders recognize the change and they keep buying, expecting summer to return. Emotionally, it is hard to sell short in autumn - it requires you to stand apart from the crowd, which is still bullish. In fact, autumn is the best time for selling short. The profit potential is high, while risks can be limited by placing a stop above the recent highs or using options.
When
MACD-Histogram falls below its centerline, it is winter in the market. By
then, most traders recognize the downtrend. It is emotionally easy to sell short
in winter, joining many vocal bears. In fact, the risk/reward ratio is rapidly
shifting against bears. Potential rewards are getting smaller and risks are
high because stops have to be placed relatively far away from prices.
The concept of seasons can be applied to almost any indicator, even though this example focuses on the weekly MACD-Histogram. It helps you trade in gear with the markets.
Autumn-the indicator is above its centerline but falling. This is the best season for establishing short positions.
Winter-the indicator drops below its centerline. Use weakness to take profits on short positions.
Spring-the indicator turns up from below its centerline. It is the best time to establish long positions. Notice "a cold spell" in spring when prices fell to a new low and MACD-Histogram ticked down temporarily. Do not sell short when MACD-Histogram turns down from below its centerline. Do not buy when it turns up from above its centerline. A bullish divergence when prices fall to a new low while the indicator makes a more shallow bottom gives a powerful buy signal.
Summer-the indicator rises above its centerline. When the weather gets hot, use strength to take profits on long positions.
Just as a farmer pays attention to the vagaries of weather, a trader needs to pay attention to the vagaries of the markets. An autumn on the farm can be interrupted by an Indian summer, and a market can stage a strong rally in autumn. A sudden freeze can hit the fields in spring, and the market can drop early in a bull move. A trader needs to use his judgment and apply several indicators and techniques to avoid getting whipsawed (see Section 43).
The concept of indicator seasons focuses a trader's attention on the passage of time in the market. It helps you plan for the season ahead instead of jumping in response to other people's actions.
Retracements
Many traders watch price retracements. For example, if a market rallies 120 points, traders try to add to long positions when the market retraces 50 percent of the preceding move and declines 60 points from the top.
Many floor traders look for a trend to reverse after it retraces 61.8 percent of the previous move. This number is based on the Fibonacci number series.
This idea of measuring retracements can also be applied to time. It pays to measure how long each rally and decline have lasted. For example, rallies in a bull market are often interrupted by declines that last approximately half as long as the preceding rallies. If you discover that rallies tend to last 8 days and declines 5 days, that knowledge encourages you to look for a buying opportunity 4 days into a decline.
The Factor of Five
Analysts often feel confused when they look at charts in different timeframes and see that the market is going in several directions at once. The trend may be up on the daily charts but down on the weeklies, and vice versa. Which of these trends will you follow? This becomes even more complex if you look at intraday charts. Most traders pick one timeframe and close their eyes to others - until a sudden move outside of "their" timeframe hits them.
The factor of 5 links all timeframes. If you start with monthly charts and proceed to the weeklies, you will notice that there are 4.5 weeks to a month. As you switch to daily charts, you will see 5 trading days to a week. As your timeframe narrows, you will look at hourly charts -and there are approximately 5-6 hours to a trading day. Day-traders can proceed even further and look at 10-minute charts, followed by 2-minute charts. All are related by the factor of 5.
The proper way to analyze any market is to analyze it in at least two time-frames. They should be related by the factor of 5. When you analyze the market in two timeframes, the shorter of them has to be five times shorter than the longer one. If you want to analyze daily charts, you must first examine weekly charts, and if you want to day-trade using 10-minute charts, you first need to analyze hourly charts. This is one of the key principles of the Triple Screen trading system (see Section 43).
|
