ALTE DOCUMENTE
|
||||||
G. Stojanowska,1 and J. M. Jones2*
Institute of Heat Engineering and Fluid Mechanics, Wroclaw University of Technology, Wybrzeze Wyspianskiego 27, 50 - 370 Wroclaw, Poland
Energy
& Resources Research Institute, SPEME,
Abstract: Two biomass (pine and wheat) and a Polish lignite (Turoszow) have been studied for the influence of minerals and ion-exchanged calcium on their pyrolysis behaviour. Samples were demineralised with 2M HCl to remove alkali and alkaline earth metals. They were then ion exchanged with calcium acetate solutions of different molarity. The samples of each of the fuel (raw, demineralised and ion exchanged) were studied alone, and in combination for their pyrolysis behaviour using a variety of laboratory scale methods including pyrolysis-gas chromatography-mass spectrometry (py-gc-ms) and thermogravimetric analysis coupled to a FTIR spectrometer (TGA-FTIR). Apparent first order rate parameters were calculated for the main decomposition ranges in the TGA/DTG experiments. Ion-exchange worked well for all samples, but particularly for the biomass, and the wt% Ca introduced followed the order wheat (4.17 wt%) > pine (1.74 wt%) > coal (0.80 wt%). The degree of catalysis displayed by the calcium during pyrolysis of the ion-exchanged samples varied between the different fuels. Significant catalysis by calcium was observed in pyrolysis of pine, but only a small effect was seen for wheat and very little for coal. The inherent minerals also play a catalytic role in all the samples studied, but potassium is by far the most important in the pyrolysis of the raw wheat straw. The gases and light volatiles are influenced by the presence of catalytic metal. For catalysed pine pyrolysis, a shift was seen in the gas evolution profiles of all monitored species (H2O, CO, CO2, methane, formaldehyde, acetaldehyde, formic acid and acetic acid), and the shape of the profiles of the volatile organics and methane also changed. In addition new peaks were seen in the pyrolysis-gc-ms of the ion-exchanged pine, indicative of a different pyrolysis mechanism
Keywords: co-pyrolysis, coal, biomass, calcium, catalysis, pyrolysis rate, pyrolysis products.
Catalysed gasification of coal has been a topic of great interest for a number of decades, and a number of materials have been investigated, particularly dolomites, calcium-based materials, and alkali metals [1-5]. Studies have mainly concentrated on the char gasification stage, for example references 6-10. More recently, catalysed biomass gasification has been of interest, in particular since there can be a high content of inherent catalytic minerals and metal salts [11,13].
The advances in catalytic gasification have been driven by the need to produce a tar-free product gas, and the literature in this area ranges from papers on bench-scale reactors to those on the use of plant-scale gasifiers. Recently, there has been growing attention in the possibility of co-gasifying coal and biomass to offset carbon dioxide emissions. An intriguing question is whether the minerals inherent in biomass have a beneficial effect on the pyrolysis/gasification of the coal, and vice-versa, and there have been a few recent papers on this topic, with mixed findings.[14-18]
Catalysts for use in coal/ biomass conversion may be divided into two groups, which depend on the position of the catalytic reactor relative to that of the gasifier in the gasification process. The first group of catalysts (primary catalysts) is added directly to the fuel samples prior to gasification. The addition is either by wet impregnation of the coal/biomass material or by dry mixing. This group of catalysts primarily have the purpose of reducing the tar content and effect the conversion of methane and C2+C3 hydrocarbons in the product gas; there is also interest in catalysing the shift reaction to favour H2 production in the gasifier. The second group of catalysts is placed in a secondary reactor downstream from the gasifier. These catalysts are active in reforming higher hydrocarbons and methane. The former application is of interest for the present study and a brief review of the current position is given here.
The main candidates for in situ catalysis of coal/biomass gasification are the alkali and alkaline earth metals. In particular, dolomite, limestone, calcium salts, as well as sodium and potassium salts have been studied. The use of calcium carbonate has been explored as a less expensive substitute than other alkali and alkaline earth salts. Compared to coal, there have been fewer investigations of the effect of calcium on biomass pyrolysis and gasification. Although alkaline earth metallic salts can catalyse several gasification reactions their activity is generally lower than the alkali metal salts [10,11]. Their dispersion is more variable and depends on preparation method [10,20,21]. In general, it is found that the presence of these primary catalysts affects both the pyrolysis stage and the char gasification stage. In pyrolysis, a reduction in tars, and increases in char and gas yields are reported [11, 23-27], although the mechanism for this is still unclear. The metals retained in the char then catalyse its gasification, so that improved efficiency is observed [28].
Like coal, the yield and distribution of char, gas and tar from pyrolysis, depends upon the heating rate, final temperature, and hold time. However, for biomass the depolymerisation reaction is the dominant pyrolysis reaction, whereas for coal depolymerisation competes with cross-linking and char formation. Catalytic metals have an important influence on the depolymerisation and secondary cracking reactions,[22,25-27] but the nature and extent of this influence also depends on heating rate and temperature [29].
The char gasification stage, in particular, has been studied in some detail. Potassium carbonate has been reported to have the highest activity, while the effectiveness of calcium appears to depend on its distribution on the carbon surface so that ion exchanged chars are more active than impregnated ones [20,30]. Calcium has also been shown to be an effective catalyst in the process of steam gasification of carbon for the preparation of active carbon [20,24] Leboda et al. [20] showed that ion exchange of calcium into the carbon results in a more effective catalyst for the creation of a mesoporous structure compared to calcium deposited by the impregnation method. The calcium catalyst causes a decrease in the energy activation for the gasification of carbon with water vapour from 185 to 164 kJ/mol. Several researchers have shown the catalytic activity of sodium in coal char depends on its dispersion and chemical forms. Sodium loaded into a coal substrate as NaCl can have very different catalytic effect on the char reactivity compared to sodium carboxylates. Quyn et al. [31] found that the catalytic activity for sodium in gasification in air depended upon the mobility of sodium to the surface of pores. High temperature and/or low chlorine contents favour the development of a more active form of sodium for gasification catalysis.
Inherent mineral matter also plays a significant role. Being a major plant nutrient, the inherent potassium content in biomass can be relatively high, and alkali catalysed gasification of biomass is well-documented. Likewise, the calcium content of lignite is variable, and a high calcium content is beneficial in lignite gasification.[28] According to Quyn and Wu [31] alkali and alkaline earth metallic species in coal exist in two main forms: as carboxylates and as soluble salts (E.g. NaCl). Depending on the geographical location in the coalfield, the NaCl dissolved in the coal-bed moisture can account for more than 70% of the total sodium in coal. The presence of these alkali and alkaline earth metallic species is always an important consideration for the utilization of coal since they can act as excellent catalysts for the gasification of coal.
Co-gasification of biomass and coal has been proposed as a means to move from energy production based on fossil fuels towards energy production based on renewable fuels. It has been reported that synergistic effects can occur in char co-gasification, such as increased char reactivity and reduced pollution emission.[13,19] Biomass, which can contain large amounts of potassium, calcium and sodium, may prove to be an excellent source of inexpensive gasification catalysts. Findings are mixed however. Brown and co-workers [14] report catalysed gasification of coal char when mixed with switchgrass char or ash. However, other groups see only additive behaviour in pyrolysis and/or gasification of coal/biomass mixtures using a range of pyrolysis conditions and fuel types.[15,17-19]
Previous investigations of co-pyrolysis of biomass, coal and coal/biomass blends have mostly been empirical measurements of the production and composition of the gas phase species or the char yield. The inherent metal content of the biomass is expe 22422d316w cted to be a key factor in the presence or absence of synergy. Most studies to date have not fully characterised the fuels involved in co-pyrolysis or co-gasification reactions for inherent metals, and fundamental studies are needed to clarify the criteria for synergy.
There has been some suggestion that demineralisation of coal through acid treatment influences the degree of synergy observed.[33] However, additive versus non-additive behaviour in coal/biomass co-pyrolysis, co-gasification or co-combustion could depend on many factors such as reactor configuration, heating rate and the relative rates of pyrolysis, gasification and/or combustion. The latter factors will be dependent upon the amount and nature of catalytic metals in the two fuels and their mobility and chemistry during thermal processing [30].
The present work seeks to explore the behaviour of calcium during co-pyrolysis of coal/biomass blends. A lignite coal, a woody biomass (pine) and straw (wheat) have been studied. These fuels were demineralised to remove inherent catalytic species and then calcium added by ion-exchange. A parametric themogravimetric study is presented. The influence of blending ratio and the influence of the calcium catalyst is discussed.
2. Experimental
2.1. Materials
Two types of biomass (wheat straw, pine sawdust) and coal Polish lignite, Turoszow, have been used. Proximate analysis was measured by thermogravimetric analysis, and ultimate analysis was measured using a CE Instruments Flash EA 1112 Series elemental analyser and the coal and biomass properties are given in Table 1. Particle size measurements indicated a range of particle sizes between 0.080-0.100 mm for lignite and 0.090-0.125 mm for biomass samples. Samples were demineralised by washing in 2M HCl at a temperature 50oC for 48 hours in order to remove the alkali and alkaline earth metals. Some of demineralised samples were ion exchanged with aqueous solutions of calcium acetate of different concentrations, as indicated in Table 1. A full description of the demineralisation and ion exchange procedure has been given previously [34]. The samples were analysed for their metal contents by low temperature ashing and dissolution in HCl followed by analysis by inductive coupled plasma (ICP) spectrometry; the results are shown in Table 2.
2.2. Analysis pyrolysis tests
GC-MS provides an
on- line analysis of the pyrolysis products (tar and volatile organics), on a
molecular weight basis, as the coal or biomass and coal/biomass blends are heated. Pyrolysis-GC was performed on each of the
fuels using a CDS 1000 (CDS instruments) coupled to a HP GC-MSD gas
chromatograph. A 25m 0.32 id, 0.25 um
phase thickness DBX5 capillary column (Thames Restek,
2.3. Thermogravimetric analysis
Thermogravimetric analysis/differential thermal analysis (TGA/DTG) was performed for the individual fuels and fuel mixtures, using a Stanton Redcroft STA1000. Approximately 5 mg of sample was heated in nitrogen at a rate of 20oC/min to 900oC. The TGA was coupled via a heated gas transfer line to a heated gas cell in the sample compartment of a Nicolet Magna 560 FTIR spectrometer. Spectra of the evolving gas mixture were measured every 30 s at 4 cm-1 resolution. Gas evolution profiles of major species were constructed by following the change in absorbance as a function of time (or temperature) at characteristic frequencies. There are a number of compounds present with bands in the C-O stretching and bending regions of the infra red spectra, and so it is possible that there is some interference in the acid and aldehyde evolution profiles. The apparent first order pyrolysis rate constants, k', were calculated as a function of temperature, from the weight loss - time curves assuming that:
![]() (1)
(1)
where wo is the weight of pyrolysable material, and wt is the weight at any given time, t.
3. Results and Discussion
Table 2 gives the metal analysis of the different fuels used in this study. The demineralisation treatment is very successful for decreasing the contents of potassium, sodium, magnesium and phosphorus. The calcium contents also decrease dramatically for all but the pine sample. Ion exchange with calcium acetate is a very effective means of introducing calcium to all three samples, and on a mass basis the calcium contents of the ion exchanged samples follow the order wheat straw (4.2 wt% Ca) > Pine (1.7 wt%) > coal (0.8 wt%). The same order of calcium content is seen when calculated on a dry ash free basis.
Figures 1 show the results of the TGA pyrolysis experiments. The data is displayed as derivative thermogravimetric (DTG) plots so that the position of the peak maxima can be more easily elucidated. By comparing the metal analysis given in Table 2 with these figures it is possible to examine the influence of mineral and calcium contents on pyrolysis. Figure 1(a) compares the DTG for the three coal samples. For all three samples pyrolysis occurs over a wide temperature range of approximately 500 - 850K, and there are only very small differences in the three DTG traces. Demineralisation removes the majority of the inherent calcium (as well as a large fraction of other metals) from the coal, but there is very little effect on the pyrolysis behaviour. However, there is a small downward shift in temperature of the DTG peak (the temperature corresponding to the maximum rate of weight loss) of approximately 7 K. The ion-exchanged sample behaves almost identically to the demineralised sample and the added calcium has very little affect on the pyrolysis. The Arrhenius plots derived from Figure 1(a) are given in Figure 2(a), and the calculated apparent first order pyrolysis rate parameters are given in Table 3. To enable easy comparisons, Table 3 also gives the apparent rate calculated at 673K. These also illustrate that there is very little difference between the three coal samples, particularly the raw and ion exchanged samples. The activation energies for pyrolysis are 56-57 KJ/mol-1.
The wheat straw pyrolysis results given in Figure 1(b) are quite different. For all samples, two distinct pyrolysis regions are apparent, a broad decomposition peak below ~ 580 K (Peak 1) and a narrow decomposition peak above this temperature (Peak 2). This is illustrative of the different chemical composition of biomass compared to coals; the first peak is generally considered to be mainly due to hemicellulose decomposition, and the second peak mainly due to cellulose and hemicellulose pyrolysis [35]. The lignin pyrolysis is expected to give rise to a broad unresolved peak [35]. The raw wheat sample has the fastest pyrolysis rate of all the fuels studied, and one of the noticeable differences in the metal content of this fuel is the high potassium content. The presence of this metal in particular sharpens both decomposition regions, and in particular shifts Peak 2 to a much lower temperature. From Table 2 it can be seen that upon demineralisation, nearly 90% of this potassium is removed, together with over 70% of the inherent calcium. This results in a fuel with a much slower pyrolysis rate, broader decomposition peaks, and the DTG peak maximum temperature for the Peak 2 increases by 22 K. Ion-exchange with 0.8 M Ca acetate is very successful and the resultant fuel contains over 4 wt% Ca. This is seen to weakly catalyse the pyrolysis of both DTG peaks and the peak maximum temperature for the second peak decreases by ca. 6 K.
The Arrhenius plots derived from Figure 1(b) are given in Figure 2(b), and the corresponding apparent first order rate parameters given in Table 3. For all three samples rate data is reported for both peaks in the DTG traces, and the apparent rate calculated at 673 K is also reported. It is clear by comparison of the raw and demineralised samples that the inherent minerals and metals in raw wheat straw, particularly potassium, catalyse both peaks. Ion exchange with calcium appears to weakly catalyse pyrolysis of the first peak but inhibit pyrolysis of the second peak.
For the pyrolysis of pine, demineralisation removes over 90% of the inherent potassium, but only 6% of the inherent calcium. The DTG traces in Figure 1 (c) again display two weight loss regions, although not as well resolved as for the wheat straw samples. The DTG peak temperature for the demineralised sample is seen to increase by 6 K relative to the raw fuel. Ion exchange is again very successful, and the resultant fuel contains 1.7% Ca. A large catalytic effect of calcium is seen in the case of this fuel, with the DTG peak maximum temperature decreasing by 21 K. The Arrhenius plots and rate parameters for both peaks were derived from Figure 1(c) and are given in Figure 2(c) and Table 3 respectively. Examination of the calculated rates at 673 K indicates that demineralisation has little effect on Peak 1, but affects the pyrolysis of Peak 2. For this fuel, ion exchange with calcium has a catalytic effect on the pyrolysis rates associated with both peaks, but particularly Peak 1.
For the two biomass samples, ion exchange was also performed with 0.5 M calcium acetate. These fuels displayed similar trends to those shown in Figure 1.
Figure 3 shows typical waterfall spectra seen during evolved gas analysis in the TGA-FTIR experiments. Major species of CO2, CO, H2O and CH4 are identified for biomass, as well as oxygenated organics such as aldehydes and acids. Similar gaseous species are seen for the coal sample, but the hydrocarbons are more dominant and oxygenated volatile compounds are minor. For biomass, depolymerisation is the main pyrolysis reaction,[36] whereas for coal the competing reactions of depolymerisation and cross-linking with char formation are both important.[37] Both biomass and low rank coal produce similar amounts of CO2, CO and H2O,[38] but biomass produces a highly oxygenated tar fraction at the expense of char. Coal, with a more aromatic structure, gives a higher char yield than biomass; this is illustrated in Table 1.
Gas evolution profiles were constructed from the waterfall spectra and some of the major species are given in Figures 4-6. These profiles have been normalised to sample weight so that comparisons can be made for the effect of pre-treatment on the relative amount of gaseous species evolved.
The main species observed in the TGA-FTIR pyrolysis of the lignite (Fig 4) are H2O (not shown) CO2, CO, methane, light hydrocarbons and sulphur species. The profiles for CO2, methane, and possibly CO and H2S are bimodal, while a single peak is seen for the other light hydrocarbons and SO2. The light hydrocarbons are indicative of tar formation through fragmentation of the coal macromolecular network. Coincident with this is the release of some CO2, CO, methane and sulphur species, but the release of these gases also continues at higher temperatures possibly indicative of loss of functional groups through homolytic bond breaking. Solomon et al. [39] described these two regions of gas evolution as "loose" and "tight". All three coal samples present similar gas evolution profiles, the exception is for the CO profile, where the raw and ion-exchanged samples show increasing evolution with temperature, while the demineralised sample shows a decrease in CO release above ~ 950K. The higher temperature CO evolution for the raw an ion exchange coal sample may be due to calcium carbonate decomposition.
The main species resloved in the TGA-FTIR pyrolysis of the biomass samples (Figures 5 and 6) are H2O, CO2, CO, methane, formaldehyde, acetaldehyde, formic acid and acetic acid. These species have been observed in primary pyrolysis products, although the gaseous species also arise during secondary and tertiary cracking [40].
For wheat straw (Figure 5), all species with the exception of methane show a coincident peak maximum. The methane peak maximum is shifted to a much higher temperature (by approximately 200K). Jensen et al. [25] observed similar profiles for pyrolysis of Danish wheat straw. The volatile organic (aldehydes and acids) profiles appear to be bimodal for the demineralised and ion-exchanged samples. CO evolution (and CO2) also occurs over a second temperature region above 850 K. Presentation of the data in Figure 5 gives the gas evolution profile over the whole pyrolysis temperature range so that the complete profiles can be compared. It is difficult to distinguish from this temperature scale, but the effect of demineralisation is to shift all peak maxima to a higher temperature, and this is much more noticeable for the gaseous species. It is also noticeable that the raw wheat sample (K catalysed pyrolysis) generally has higher yields of CO, CO2 and H2O compared to the demineralised and ion-exchanged sample. Ion-exchange with calcium produces only small changes in the gas evolution profiles, indicating that it is not displaying strong catalytic behaviour for the pyrolysis of this fuel.
The gas evolution profiles in the pyrolysis of the pine samples are presented in Figure 6. In general the profiles are similar in shape to the wheat straw gas evolution profiles in Figure 5. The exception is the methane peak, which is distinctly bimodal. Similar profiles were seen for wood pellets [41]. Lignin gives a bimodal methane evolution profile in TGA-FTIR [25], and the higher lignin content of pine compared to wheat straw may explain the difference between the two biomass materials. Demineralisation tends to decrease the yield of gaseous species in this sample, but increase the yield of volatile organics. Ion-exchange with calcium shifts all the peaks to slightly lower temperature, and changes the shape of the profiles of volatile organics and methane. It is interesting that ion exchanged calcium is more catalytically active in the pine compared to the wheat straw. Further characterisation is needed to explain this. It is welll known that the dispersion and form of calcium impacts on its activity in gasification [10,20,21] and this may be a contributing factor here.
The heavier hydrocarbons produced during pyrolysis were studied using py-gc-ms and the results are given in Figures 7-9 show for the coal, pine and wheat samples. Mass spectral detection, together with published data [40,42-45], enabled suggested assignment of the main peaks, and these assignments are given in the Figure captions.
The chromatograms in Figure 7 are typical for low rank coal pyrolysis [46]. Peaks are identified for phenols, alkyl phenols, methoxyphenols, n-alkanes and polyaromatic hydrocarbons, as well as unresolved low molecular weight compounds. Subtle changes in the fingerprints are observed upon demineralisation, although the raw and calcium ion exchanged profiles are remarkably similar.
The chromatograms in Figures 8 and 9 are typical for biomass and have more oxygenated components such as phenols and sugar units originating from the original lignocellulosic material. There are clear differences in the pyrolysis fingerprints of the wheat straw samples shown in Figure 8 and new peaks were present whose identities have yet to be confirmed. The most important is perhaps that the raw wheat straw has a much less significant peak for levoglucosan compared to the demineralised and ion exchanged samples. Work on the mechanism of cellulose pyrolysis by Julien et. al. [29] and Evans and Milne [40] indicates that potassium influences the mechanism of cellulose pyrolysis and decreases the formation of levoclucosan compared to pure cellulose. It has been proposed that the catalysed route results in the formation of more furfural derivatives [29,40]. Furfural elutes at ca. 5 min. and is observed in all the gc-ms chromatograms in Figures 8 and 9. Because it is not well-resolved, it is difficult to quantify if the concentration of this is higher for the raw wheat straw sample.
The py-gc-ms chromatograms of the pine samples are shown in Figure 9. As well as primary pyrolysis products, later eluting products are observed, which possibly indicate that secondary and tertiary cracking was taking place [40]. A key difference in the chromatograms can be observed in Fig 9(c), where new products are seen to elute at retention times of ~ 10 min. and ~ 16 min (marked with an asterisk). A mass spectral library search suggests that the latter peak is composed of furan and furfural derivatives. More work is needed to confirm the identity of these peaks, but this is evidence that the Ca-catalysed pyrolysis is following a different mechanism to the uncatalysed reaction.
It was of interest to examine if the calcium added to one fuel could influence a second. Since the largest catalytic effect had been observed for pine, this material was chosen to examine further. Consequently, mixtures were prepared of different combinations of coal and pine. Figures 10 and 11 give typical examples of DTG traces for pyrolysis of 75% ion-exchanged coal/25% demineralised pine, and 75% demineralised coal/25% ion exchanged pine. For both mixtures there appears to be mostly additive behaviour. In Figure 10 there is a difference in the behaviour of pyrolysis in the low temperature region of the ion-exchanged coal/demineralised pine mixture. Unfortunately, in this low temperature region, the rate appears to be dominated by the coal pyrolysis rate and the apparent rate at 673 K is approximately 0.0018 s-1 which is comparable to the ion exchange rate calculated From Fig.1(a) and given in Table 3. The higher temperature pyrolysis region is slightly slower than that observed for demineralised pine. In conclusion, from considering only the TGA experiments it seems that the catalyst added to the coal does not influence the pyrolysis behaviour of the biomass in a positive way (or vice versa). In fact, the results suggest that the coal inhibits the biomass pyrolysis behaviour, although the evidence for this is very limited. Future work will look at the resulting chars in more detail to see how the added catalyst influences the char gasification stage.
Calcium was successfully introduced into demineralised coal (lignite), wheat and pine at 0.80 w%, 4.17 wt% and 1.74 wt% respectively. The pyrolysis behaviour of these samples were compared with the analogous raw and demineralised fuels using TGA/DTG, TGA-FTIR and pyrolysis-gc-ms. Apparent first order rate parameters were calculated for the main decomposition ranges in the TGA/DTG experiments. Very little catalytic activity of calcium was seen for the lignite, and only a small catalytic effect was observed for wheat straw pyrolysis. The indigenous minerals in wheat straw, particularly potassium, were seen to strongly catalyse the pyrolysis. The greatest catalytic effect of calcium was seen in pine pyrolysis. The added calcium increased the rates of pyrolyis over both of the main decomposition regions, but particularly the lower temperature range and the main pyrolysis DTG peak temperature shifted by 21K. A similar shift was seen in the gas evolution profiles of all monitored species (H2O, CO, CO2, methane, formaldehyde, acetaldehyde, formic acid and acetic acid), and the shape of the profiles of the volatile organics and methane also changed. In addition new peaks were seen in the pyrolysis-gc-ms of the ion-exchanged pine, possibly furan and furfural derivatives. Thus, the calcium introduced by ion-exchange changes the mechanism of pine pyrolysis.
Mrs Stojanowska is
grateful for Marie Curie funding from the EU. Dr. Jones thanks the EPSRC for her Advanced Fellowship (GR/S49018). The authors are extremely grateful to Mr.
Peter Thompson and Ms. Rachel Gasior (
Nahas N C, Vadovic, C.J., "Process for the catalytic gasification of coal" US Patent US4077778 (1978).
Pabst J. K., Lang, R.J., "A process for the catalytic gasification of coal", European Patent EP0035887 (1981)
Hippo, E.J., Tandon, D. "Low temperature steam coal gasification catalysts" Preprints Am Chem. Soc., 41(1) 216-220 (1996)
Lizzio A.A., "Increasing
reactivity of
Hauserman, W.B., "High-yield hydrogen production by catalytic gasification of coal or biomass", International Journal of Hydrogen Energy, 19 (5) (1994) 413-419.
McKee D. W., "The catalysed
gasification reactions of carbon." In Walker Jr P., Thrower P., Eds., Chemistry
and Physics of Carbon vol. 16.,
Walker Jr. P.L., Shelef M.,
Anderson R.A., Catalysis of Carbon Gasification. In
Walker, P. L., Jr., Matsumoto S., Hanzawa, T., Muira T., and Ismail, I.M.K., Catalysis of gasification of coal-derived cokes and chars, Fuel 62 (1983) 140-149.
McKee, D.W., Mechanisms of the alkali metal catalysed gasification of carbon, Fuel 62 (1983) 170.
Liu, Z., -I., and Zhu H.-h, Seam gasification of coal char using alkali and alkaline-earth metal catalysts, Fuel 65 (1986)1334-1338.
Sutton D., Kelleher B., Ross J., Review of literature on catalyst for biomass gasification, Fuel Processing Technology, 73, 2001, p. 155-173
Bridgwater, A.V., Catalysis in thermal biomass conversion, Applied Catalysis A: General 116 (1994) 5-47.
Myren, C., Hornell C, Bjornbom, E, Sjostrom K., "Catalytic tar decomposition of biomass pyrolysis gas with a combination of dolomite and silica" Biomass & Bioenergy 23 (3) , 2002 217-227.
Brown R.C, Liu, Q., Norton, G., Catalytic effects observed during the co-gasification of coal and switchgrass, Biomass and Bioenergy, 18 (2000) 499-506.
Collot A.-G., Zhuo, Z., Dugwell, D.R., and Kandiyoti, R., Co-pyrolysis and co-gasification of coal and biomass in bench-scale fixed-bed and fluidised bed reactors, Fuel 78 (1999) 667- 679.
Hauserman W.B., J. Hydrogen Energy 19 (1994) 413.
Vamvuka D., Kakaras, E., Kastanaki, E., Grammelis, P., Pyrolysis characteristics and kinetics of biomass residuals mixtures with lignite, Fuel 82 (2003) 1949-1960.
Jones, J.M., Kubacki, M., Kubica, K., Ross, A.B. and Williams A., Devolatilisation characteristics of coal and biomass blends, J. Anal., Appl. Pyrol., 73 (2005) 197-206.
Pan Y.G., Velo, E., Puigjaner, L., Pyrolysis of blends of biomass with poor coals, Fuel 75 (1996), 412-8.xx
Leboda R., Grzegorczyk W., Effect of calcium catalysts loading procedure on the porous structure of active carbon from plum stones modified in the steam gasification process, Carbon, 36, 1998, p. 417-425.
Ganga Devi, T., Kannan, M.P., "Calcium catalysis in air gasification of cellulosic chars", Fuel 77 (1998) 1825-1830.
Jones, J. M, Nawaz, M., Ross, A. B., Pourkashanian, M. & Williams, A. Catalysis by Potassium in the Pyrolysis and combustion of Biomass. Proceedings of Clean Air 2003, Seventh International Connference on Energy for a Clean Environment, 7-10 July 2003, Lisbon, Portugal.
Antal Jr., M.J., Mok, W. S. L., Varhegyi, G., and Szekely, T., "Review of Methods for improving the yield of charcoal from biomass", Energy & Fuels, 4 (1990) 221-225.
Antal Jr., M. J., Gronli, M., "The art, science and technology of charcoal production", Ind. Eng. Chem. Res., 42 (2003) 1619-1640.
Jensen, A., Dam-Johansen, K., Wojtowicz, M.A., and Serio, M.A., "TG-FTIR study of the influence of potassium chloride on wheat straw pyrolysis", Energy & Fuels, 12 (1998) 929-938.
Nowakowski, D. J. Jones J.M.,
"Catalysis by potassium in the pyrolysis processes of biomass and basic biomass
components", World Renewable Energy Congress,
Richards, G.N., Zheng, G., "Influence of metal ions and of salts on products from pyrolysis of wood: applications to themochemical processing of newsprint and biomass", J. Anal. Appl. Pyrol., 21 (1991) 133-146.
Skodras, G., and Sakellaropoulos, G.P., Mineral matter effects in lignite gasification, Fuel Proc. Technol., 77-78 (2002), 151-158.
Julien, S., Chornet, E., Tiwari P.K., Overend R.P., "Vacuum pyrolysis of cellulose: Fourier Transrom infrared charcterization of solid residues, product distribution and correlations", J. Anal. Appl. Pyrol, 19 (1991) 81-104.
Risnes, H., Fjellerup J., Henriksen U., Moilanen, A., Norby, P., Papadakis, K., Posselt, D., Sorensen, L.H., Calcium addition in straw gasification, Fuel 82 (2003) 641-651.
Quyn D., Wu h., Volatilisation and catalytic effect of alkali and alkaline earth metallic species during the pyrolysis and gasification of Victorian brown coal, Fuel, 82, 2003, p. 587-593.
Lang R. J. and Neavel R. C., Behaviour of calcium as a steam gasification catalyst, Fuel 61 (1982) 620-626.
Suelves, I, Moliner, R., Lazaro, M.J., J. Anal. Appl. Pyrol. 55 (2000) 29-41.
Kordylewski, W., Zacharczuk, W., Hardy, T., Kaczmarczyk J., "The effect of the calcium in lignite on its effectiveness as a reburn fuel." Fuel (in press).
Orfao, J.J.M., Antunes, F. J. A., Figueiredo, J.L., "Pyrolysis kinetics of lignocellulosic materials - three independent reactions model". Fuel 78 (1999) 349-358.
Shafizadeh, F., in The
Chemistry of Solid Wood (R.M. Rowell, Ed.), Advances in Chemistry Series No.
207, American Chemical Society,
Solomon P.R., Hamblen, D.G., Serio, M.A., Yu, ZZ., and Charpenay, S., Fuel 72 (4) (1993) 469-488.
Chen, Y., Charpenay, S., Jensen, A., Wojtowicz, M.A., and Serio, M.A., Modeling of biomass pyrolysis kinetics, Twenty-Seventh Symposium (International) on Combustion, The Combustion Institute 1998 1327-1334.
Solomon, P.R., Serio, M.A.,
Carangelo, R.M., Bassilakis, R., Gravel, D., Baillargeon, M., Baudais, F.,
Vail, G., "Analysis of the
Evans, R.J., and Milne, T.A., "Molecular characterization of the pyrolysis of biomass. 1 Fundamentals." Energy & Fuels, 1 (1987) 123-137.
de Jong, W., Pirone, A., Wojtowicz, M.A., "Pyrolysis of Miscanthus Giganteus and wood pellets: TG-FTIR analysis and reaction kinetics.", Fuel 82 (2003) 1139-1147.
Moreira dos
Simoneit, B. R.T., Biomass burning - a review of organic tracers for smoke from incomplete combustion Appl. Geochem. 17 (2002) 129-162.
Bassilakis, R. Carangelo, R. M. Wójtowicz, M. A. Fuel 80(12) (2001) 1765-1786.
Horne, P. A. Williams. P.T. Fuel 75(9) (1996) 1043-1050.
Smith K. L., Smoot, L. D.,
Fletcher, T. H., and Pugmire, R.J., "The Structure and Reaction Processes of
Coal", Plenum Press,
Table and Figure Captions
Table 1: Ultimate and proximate analysis of fuel samples
Table 2: Metal analysis (as received, ppm (mg/kg)) for samples of coal, biomass and coal/biomass blends.
Table 3: Derived rate parameters for the pyrolysis of the different fuels. Also given is the apparent rate constant calculated at 673K.
![]()
![]()
![]() Figure 1. DTG during pyrolysis under nitrogen of (...) raw, (..)
demineralised, and (..) ion exchanged samples of (a) coal, (b) wheat straw, and
(c) pine. Heating rate:20 K/min.
Figure 1. DTG during pyrolysis under nitrogen of (...) raw, (..)
demineralised, and (..) ion exchanged samples of (a) coal, (b) wheat straw, and
(c) pine. Heating rate:20 K/min.
Figure 2: Arrhenius plots for the pyrolysis of (a) coal, (b) wheat straw, and (c) pine; (i) raw (ii) demineralised, (iii) ion exchanged. Bold lines show the regions used in the calculation of the rate parameters given in Table 3.
Figure 3: Typical waterfall FTIR spectra observed during the TGA-FTIR pyrolysis experiments for biomass (demineralised wheat is shown).
![]()
![]()
![]() Figure 4: Gas evolution
profiles of the main gas and volatile organic species during pyrolysis under
nitrogen of (...) raw, (..) demineralised, and (..) ion exchanged samples of
coal. (a) CO2, (b) H2O,
(c) CO, (d) CH4, (e) saturated light hydrocarbons, (f) unsaturated
light hydrocarbons, (g) aromatics, (h) H2S. Intensities have been normalised with respect
to sample weight.
Figure 4: Gas evolution
profiles of the main gas and volatile organic species during pyrolysis under
nitrogen of (...) raw, (..) demineralised, and (..) ion exchanged samples of
coal. (a) CO2, (b) H2O,
(c) CO, (d) CH4, (e) saturated light hydrocarbons, (f) unsaturated
light hydrocarbons, (g) aromatics, (h) H2S. Intensities have been normalised with respect
to sample weight.
![]()
![]()
![]() Figure 5: Gas evolution
profiles of the main gas and volatile organic species during pyrolysis under
nitrogen of (...) raw, (..) demineralised, and (..) ion exchanged samples of
wheat straw. (a) CO2, (b) H2O,
(c) CO, (d) CH4, (e) acetaldehyde, (f) formaldehyde, (g) acetic
acid, (h) formic acid. Intensities have
been normalised with respect to sample weight.
Figure 5: Gas evolution
profiles of the main gas and volatile organic species during pyrolysis under
nitrogen of (...) raw, (..) demineralised, and (..) ion exchanged samples of
wheat straw. (a) CO2, (b) H2O,
(c) CO, (d) CH4, (e) acetaldehyde, (f) formaldehyde, (g) acetic
acid, (h) formic acid. Intensities have
been normalised with respect to sample weight.
![]()
![]()
![]() Figure 6: Gas evolution
profiles of the main gas and volatile organic species during pyrolysis under
nitrogen of (...) raw, (..) demineralised, and (..) ion exchanged samples of
pine. (a) CO2, (b) H2O,
(c) CO, (d) CH4, (e) acetaldehyde, (f) formaldehyde, (g) acetic
acid, (h) formic acid. Intensities have
been normalised with respect to sample weight.
Figure 6: Gas evolution
profiles of the main gas and volatile organic species during pyrolysis under
nitrogen of (...) raw, (..) demineralised, and (..) ion exchanged samples of
pine. (a) CO2, (b) H2O,
(c) CO, (d) CH4, (e) acetaldehyde, (f) formaldehyde, (g) acetic
acid, (h) formic acid. Intensities have
been normalised with respect to sample weight.
Figure 7: Pyrolysis -gc-ms chromatograms for (a) raw coal, (b) demineralised coal and (c) calcium ion-exchanged coal. The main peaks are assigned from mass spectral detection as: 1. Phenol, 2. Methyl and di-methyl phenols; 3. Ethyl phenols; 4. methoxy phenols; 5. methoxy-ethyl phenol; 6. methoxy propenyl phenol; 7. phenanthrene; 8. hexacosane.
Figure 8: Pyrolysis -gc-ms chromatograms for (a) raw wheat, (b) demineralised wheat and (c) calcium impregnated wheat. The main peaks are assigned from mass spectral detection as: 1. propanal; 2. methoxyphenol; 3. methoxy-methyl phenol; 4. methoxy-ethyl phenol; 5. 4-hydroxy-2-methylacetonphenone; 6. eugenol; 7. vanillin; 8. methoxy propenyl phenol; 9. homovanillyl alcohol; 10. 1,6-anhydro-beta-D-glucopyranosane; 11. oleic acid.
Figure 9: Pyrolysis -gc-ms chromatograms for (a) raw pine, (b) demineralised pine and (c) calcium impregnated pine. The main peaks are assigned from mass spectral detection are the same as those given in Figure 8
Figure 10: DTG during pyrolysis of a 75% ion-exchanged coal + 25% demineralised pine mixture. For comparison purposes, also shown are the traces for pure ion-exchanged coal (x 0.75) and pure demineralised pine (x 0.25) samples. The predicted additive curve is given as a grey line.
Figure 11: DTG during pyrolysis of a 75% demineralised coal + 25% ion-exchanged pine mixture. For comparison purposes, also shown are the traces for pure demineralised coal (x 0.75) and pure ion-exchanged pine (x 0.25) samples. The predicted additive curve is given as a grey line.
Table 1
Ultimate and proximate analysis of fuel samples
|
Proximate analysis (% w/w) |
Ultimate analysis (% w/w,daf) |
||||||
Sample |
Fixed carbon FCdaf |
Volatile matter VMdaf |
Ashdaf |
Moisturea |
C |
H |
N |
|
Coal raw | |||||||
|
Coal demineralised | |||||||
|
Coal ion exchanged | |||||||
|
Wheat raw | |||||||
|
Wheat demineralised | |||||||
|
Wheat ion exchanged (0.5M calcium acetate) | |||||||
|
Wheat ion exchanged (0.8M calcium acetate) | |||||||
|
Pine raw | |||||||
|
Pine demineralised | |||||||
|
Pine ion exchanged (0.5M calcium acetate) | |||||||
|
Pine ion exchanged (0.8M calcium acetate) | |||||||
|
75%coal demineralised, 25%pine ion exchanged (0.5M calcium acetate) | |||||||
|
75% coal ion exchanged 25% pine demineralised | |||||||
Table 2: Metal analysis (as received, ppm (mg/kg)) for samples of coal and biomass.
|
Sample |
Al |
Ca |
Fe |
K |
Mg |
Na |
P |
Si |
Zn |
|
Coal raw | |||||||||
|
Coal demineralised | |||||||||
|
Coal ion-exchanged | |||||||||
|
Wheat raw | |||||||||
|
Wheat demineralised | |||||||||
|
Wheat ion-exchanged 0,8M calcium acetate | |||||||||
|
Pine raw | |||||||||
|
Pine demineralised | |||||||||
|
Pine ion-exchanged 0,8M calcium acetate |
Table 3: Derived rate parameters for the pyrolysis of the different fuels. Also given is the apparent rate constant calculated at 673K.
|
Sample |
Activation Energy, EA (KJmol-1) |
Pre-exponential, lnA (s-1) |
Apparent rate at 673K (s-1) |
|||
|
Coal | ||||||
Raw | ||||||
|
Demineralised | ||||||
|
Ion exchanged | ||||||
|
Wheat |
Peak 1 |
Peak 2 |
Peak 1 |
Peak 2 |
Peak 1 |
Peak 2 |
Raw | ||||||
|
Demineralised | ||||||
|
Ion exchanged | ||||||
|
Pine |
Peak 1 |
Peak 2 |
Peak 1 |
Peak 2 |
Peak 1 |
Peak 2 |
Raw | ||||||
|
Demineralised | ||||||
|
Ion exchanged | ||||||
(a) (b)
(c) (c) (b)
![]()
![]()
![]() Figure 1. DTG during pyrolysis under nitrogen of (...) raw, (..)
demineralised, and (..) ion exchanged samples of (a) coal, (b) wheat straw, and
(c) pine. Heating rate:20 K/min
Figure 1. DTG during pyrolysis under nitrogen of (...) raw, (..)
demineralised, and (..) ion exchanged samples of (a) coal, (b) wheat straw, and
(c) pine. Heating rate:20 K/min
(iii) (ii) (i)
(iii) (ii) (i)
(ii) (iii) (i)
Figure 2: Arrhenius plots for the pyrolysis of (a) coal, (b) wheat straw, and (c) pine; (i) raw (ii) demineralised, (iii) ion exchanged. Bold lines show the regions used in the calculation of the rate parameters given in Table 3.
CO2 Esters and -C-O- CO H2O Acids and aldehydes CO2 Hydrocarbons![]()
![]()
![]()
![]()
![]()
![]()
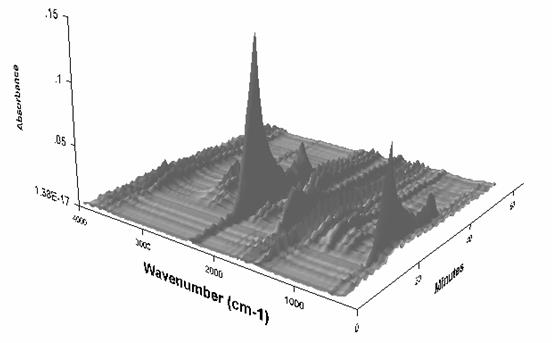
Figure 3: Typical waterfall FTIR spectra observed during the TGA-FTIR pyrolysis experiments (demineralised wheat is shown)
(b) (a)
(d) (c)
(f) (e)
![]()
![]()
![]() Figure 4: Gas evolution
profiles of the main gas and volatile organic species during pyrolysis under
nitrogen of (...) raw, (..) demineralised, and (..) ion exchanged samples of
coal. (a) CO2, (b) CO, (c)
methane, (d) C1-C4 saturated hydrocarbons, (e) H2S,
(f) SO2. Intensities have
been normalised with respect to sample weight.
Figure 4: Gas evolution
profiles of the main gas and volatile organic species during pyrolysis under
nitrogen of (...) raw, (..) demineralised, and (..) ion exchanged samples of
coal. (a) CO2, (b) CO, (c)
methane, (d) C1-C4 saturated hydrocarbons, (e) H2S,
(f) SO2. Intensities have
been normalised with respect to sample weight.
(a) (b)
(c) (d)
(f) (e)
(h) (g)
![]()
![]()
![]() Figure 5: Gas evolution
profiles of the main gas and volatile organic species during pyrolysis under
nitrogen of (...) raw, (..) demineralised, and (..) ion exchanged samples of
wheat straw. (a) CO2, (b) H2O,
(c) CO, (d) CH4, (e) acetaldehyde, (f) formaldehyde, (g) acetic
acid, (h) formic acid. Intensities have been
normalised with respect to sample weight.
Figure 5: Gas evolution
profiles of the main gas and volatile organic species during pyrolysis under
nitrogen of (...) raw, (..) demineralised, and (..) ion exchanged samples of
wheat straw. (a) CO2, (b) H2O,
(c) CO, (d) CH4, (e) acetaldehyde, (f) formaldehyde, (g) acetic
acid, (h) formic acid. Intensities have been
normalised with respect to sample weight.
(b) (a)
(d) (c)
(f) (e)
(h) (g)
![]()
![]()
![]() Figure 6: Gas evolution
profiles of the main gas and volatile organic species during pyrolysis under
nitrogen of (...) raw, (..) demineralised, and (..) ion exchanged samples of
pine. (a) CO2, (b) H2O,
(c) CO, (d) CH4, (e) acetaldehyde, (f) formaldehyde, (g) acetic
acid, (h) formic acid. Intensities have
been normalised with respect to sample weight.
Figure 6: Gas evolution
profiles of the main gas and volatile organic species during pyrolysis under
nitrogen of (...) raw, (..) demineralised, and (..) ion exchanged samples of
pine. (a) CO2, (b) H2O,
(c) CO, (d) CH4, (e) acetaldehyde, (f) formaldehyde, (g) acetic
acid, (h) formic acid. Intensities have
been normalised with respect to sample weight.
(c) (b) (a)
![]()
![]()


![]()

Figure 7: Pyrolysis -gc-ms chromatograms for (a) raw coal, (b) demineralised coal and (c) calcium ion-exchanged coal. The main peaks are assigned from mass spectral detection as: 1. Phenol, 2. Methyl and di-methyl phenols; 3. Ethyl phenols; 4. methoxy phenols; 5. methoxy-ethyl phenol; 6. methoxy propenyl phenol; 7. phenanthrene; 8. hexacosane.
(c) (b) (a)


![]()
Figure 8: Pyrolysis -gc-ms chromatograms for (a) raw wheat, (b) demineralised wheat and (c) calcium impregnated wheat. The main peaks are assigned from mass spectral detection as: 1. methyl phenols; 2. methoxyphenol; 3. methoxy-methyl phenol; 4. methoxy-ethyl phenol; 5. methoxy vinyl phenol ( or 4-hydroxy-2-methylacetophenone); 6. eugenol; 7. vanillin; 8. methoxy propenyl phenol; 9. homovanillyl alcohol; 10. 1,6-anhydro-beta-D-glucopyranosane; 11. oleic acid.
|
|
|


![]()
Figure 9: Pyrolysis -gc-ms chromatograms for (a) raw pine, (b) demineralised pine and (c) calcium impregnated pine. The main peaks are assigned from mass spectral detection are the same as those given in Figure 8
Figure 10: DTG during pyrolysis of a 75% ion-exchanged coal + 25% demineralised pine mixture. For comparison purposes, also shown are the traces for pure ion-exchanged coal (x 0.75) and pure demineralised pine (x 0.25) samples. The predicted additive curve is given as a grey line.
Figure 11: DTG during pyrolysis of a 75% demineralised coal + 25% ion-exchanged pine mixture. For comparison purposes, also shown are the traces for pure demineralised coal (x 0.75) and pure ion-exchanged pine (x 0.25) samples. The predicted additive curve is given as a grey line.
|
