Interpretation of Data
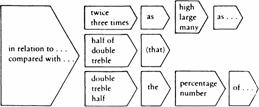
This unit looks at ways in which we can comment on significant features in diagrammatic information. For exercises throughout this unit it will be necessary to refer to the Structure and Vocabulary Aid at the end of the unit. Comparisons and contrasts will frequently be made: you may need to refer also to the Structure and Vocabulary Aid on Qualification of Comparison.
Chart 1: Pupils in state secondary schools in
Although the information contained in diagrams etc. is normally clear it usually requires some written comment. Not all the information should be described. It is usual to introduce the information with a general comment and then describe or comment on the most significant or important information.
2 Now read the following.
Introduction
Chart 1 (a histogram) shows the percentage of p 20420e418u upils in state secondary
schools in
Comment
As can be seen from the chart, a larger percentage of secondary school pupils were at comprehensive schools than at any other kind of school in 1986. In fact, comprehensive schools accounted for as much as 92% of the pupils. On the other hand, grammar schools and secondary modern schools together accounted for only 7% of the total.
Note: a 'in fact' elaborates, or expands, the previous piece of information.
b 'as much as' and 'only' draw attention to significant items.
Task 1: Comment on the percentage of p 20420e418u upils at secondary modern schools in 1966. Base your comment on the information contained in Chart 1. Write in a similar way to the comment above. Draw attention to what is significant.
Task 2: Comment on the percentage of p 20420e418u upils at grammar schools and comprehensive schools in 1986 compared with 1966.
top: a traditional church wedding bottom: a
registry office (civil) wedding
Task 3: Comment on the information in Graph 1. Before you write, look at the Structure and Vocabulary Aid at the end of this unit.
Task 4: Estimate the proportion per 1000 marriages of Church of England weddings and civil ceremonies for the year 2020. Base your prediction on the trend shown in the graph.
__________ ______ ____ __________ ______ ____ __________ ______ ____ __________ ______ ____ __________ ______ ____ __________ ______ ____ __________ ______ ____ __________ ______ ____ __________ ______ ____ _____ _______ ______ _______________
Stage 3 Diagrams and Tables
One way in which to measure the improvement in the standard of living of a country, over a period of time, is to compare the percentage of p 20420e418u eople who own, or have access to, certain products that improve the way of life (e.g. make life easier, more comfortable, more enjoyable etc.).
Task 1: Examine attentively and discuss
the significant items and trend(s) shown in the following diagram for the
products listed for
(Can you give a satisfactory definition of: standard of living; household; durable goods?)
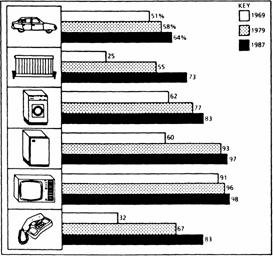
Diagram 1: Percentage of households with certain durable goods (G.B.)
Which other items would you include in the list for
Task 2 Make a list of items suitable for your country to compare the standard of living 20 or 30 years ago with today. It is not necessary to give figures. Discuss with other students your choice of items. What differences are there? Why?
The
following diagram (often called a pie chart)
gives information about family spending in
Task 3 Look at the information and then write generalised comments that draw attention to the most significant items.
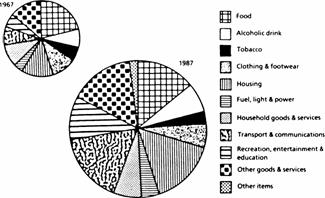
Diagram 2: Average weekly expenditure per family in G.B. (1987)
Task 3: Draw a similar diagram of family spending for your own country, or for your family (exact figures are not needed). Briefly comment on the most significant items.
Task 4: Comment on the
trend(s) shown in the following table of family expenditure in
Table 1:
Average family expenditure in
ITEM | |||
|
Food | |||
|
Alcoholic drink | |||
|
Tobacco | |||
|
Clothing and footwear | |||
|
Housing |
| ||
|
Fuel, light and power | |||
|
Household goods and services | |||
|
Transport and communications | |||
|
Recreation, entertainment and education | |||
|
Other goods and services | |||
|
Other items |
Task 5: Access the INTERNET and visit the site of the
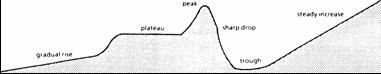
Note: Not all the words above can 'go with' each other e.g. use 'steady rise', not 'steady fluctuation'.
D Useful vocabulary for describing the information in a graph:
a trend involves a direction:
a curve involves a shape and position:
 considerably
a great deal
(very much)
(quite a lot)
rather smaller
(It is) somewhat big than.
a little cheaper
slightly etc.
scarcely
hardly
only just
exactly
precisely
just
virtually
more or less
almost
nearly
approximately
about
exactly
X is not entirely the same as.
quite
totally
entirely
quite
big
X is not quite as/so expensive as
dear
etc.
different in every way
dissimilar respect
totally
completely different
entirely
quite
|
