Advanced Quantitative Schedule Risk Analysis
David T. Hulett, Ph.D. (Hulett & Associates, LLC)
Quantitative schedule risk analysis is becoming acknowledged by many project-oriented organizations as a way to improve project on-time performance. It is included in the international standard, the PMBOK® Guide [1]. By now many project managers and executives know that a good critical path method (CPM) schedule will not provide even the most likely completion date and may not indicate as critical the path the ultimately delays the project.
A robust schedule, one that
computes the right critical path and completion date when durations change, is
needed for computing CPM schedules as projects are progressed, and for
computing schedule risk using
Project Managers (PMs) should look at the Total Float ("Slack") in the schedule, but I find that many do not. I have seen Total Float in weeks and months when the schedule is very tight, indicating a poor choice of successor or no successor at all. PMs should also look at the Critical Path and see if it makes sense. While the Critical Path may not be what you think it should be, it ought to be logical. Some schedules put the critical path through Level of Effort tasks or through paths that cannot be critical. The schedule logic should not include tasks with "open ends," (i.e. a task without successors) unless they are deliveries or the project completion milestone.
Finally, use constraints sparingly. I remember a schedule with 570 tasks where only the last 3 tasks were critical - the scheduler had put them out there with a Start No Earlier Than constraint and nothing else mattered. With some simulation packages, con 747t1917h straints can confound the process and skew the results.
In addition, there are problems with some logic that appears to be sound, Start-to-Start (S-S) or Finish-to-Finish (F-F) successor logic. Consider a S-S logical relationship. If the predecessor task's duration lengthens the successor task will not react because it is tied only to the predecessor's start date. In the picture below lengthening of "Design" should lengthen "Draft" since it is illogical for Draft to finish before Design. But this is not the result with the logic shown since Draft does not relate to the completion of Design, just to its Start
An F-F relationship can be a potential problem as well. If it is in the future, the successor's starting date is determined by the predecessor's finish date (perhaps with a lag) and its duration. If, however, the successor might take longer, the schedule software shows it starting earlier, but that could be illogical. Illogical conclusions are shown below:
F-F

S-S and F-F are convenient, but they may not "work" in a schedule and they certainly fail in a simulation.
We all know that projects tend to overrun their scheduled completion date, even if there is no pressure to adopt an unreasonably short schedule at the beginning. We also know that the Critical Path (CP) changes through the project and may not be the CP we started with, even if we have good schedule logic. A PM who is told the wrong completion date and CP early in the project can hardly be held accountable for the results, unless of course the poor information was due to his or her lack of professionalism. Is there any way to improve on the quality of this information, giving the PM a better chance of success? Yes, and it is through diligent pursuit of schedule risk analysis.
A schedule risk analysis can answer the key questions, which traditional CPM cannot address:
How likely am I to overrun my time objective?
How much time contingency do I need?
Where is the time risk the greatest in my project? Answering these questions early in the project can assist effective risk mitigation.
In a risk analysis of the schedule, the logic is assumed to be correct and given. This assumption may be wrong on both fronts, since the logic may be flawed and the PM may change logic as circumstances dictate. However, schedule risk is associated with uncertainty in the work and hence the estimates of task durations. Activity duration risk is presented using the three-point estimates and probability distributions. The durations are represented by probability distributions such as the triangular and the Beta, shown below:


It is important to place most of the emphasis and effort of a risk analysis on the issues associated with gathering the data. The credibility of the results depends on the care with which the data are collected and documented. Most people do not have experience providing three-point estimates of optimistic, most likely and pessimistic scenarios and linking them to the durations they imply. People will typically underestimate the risks (extreme scenarios) if they have not had experience in providing the data. Add to this that some people are motivated to bias the results, usually in the optimistic direction, and it becomes clear that collecting the data for a quantitative schedule risk analysis is a challenge.
Additional data are important if more advanced risk analyses are considered. The likelihood of failing a test is often underestimated, and the notion of correlation between durations is particularly elusive for those coming to this discipline for the first time. The good news is that data gathering and providing can be learned and those motivated to bias the results can be weeded out of the interviews.
We know how to tell when the
project will complete in CPM - find the critical path and add up the number of
days (including lags of course). This
method works only if the project goes "according to plan." Most projects do not proceed according to the
plan, however, in large part because there is uncertainty about how long the
tasks will take. Since we do not know
which durations each task will take, we have to examine all possible
combinations from the three-point estimates specified during the interviews,
respecting the shape of those distributions.
This schedule is supposed to finish on 11/17. There is nothing wrong with the (simple Finish-to-Start) logic, and the durations estimated are the Most Likely as shown in the ML Rdur (Remaining duration) column. Will it finish on 11/17? Is 11/17 even the most likely date for completion? Is it conservative? Simulating this schedule we see that 12/10 is a better most likely date and that 11/17 is only 10% likely to be sufficient to finish.
Parallel Paths, Merge Points and the "Merge Bias"
This is not the worst of things. Most projects contain parallel paths and those paths merge in the schedule, sometimes at crucial points such as Design Reviews, Integration for Test. The problem is that there is an extra risk at these points, called the "Merge Bias." We have known that something happens at merge points for about 40 years following the research of McCrimmon and Ryavek at Rand Corporation. [3] To explore this issue, consider the following schedule that has two extra paths that are identical to the first in all respects - tasks, logic, duration and risk range. CPM says that this schedule also finishes on 11/17, but what do you think?
Simulating this schedule demonstrates the problem when any of the three merging paths can delay the project. In this case, 11/16 is the earliest of any of the 1,000 iterations and this schedule is (.1)3 likely to complete on time.
A comparison of these two results shows the effect of the "merge bias" which is the rightward shift in the cumulative distribution in the chart below.
Risk Criticality and the "Highest Risk Tasks"
The project manager needs to know where the risk is in the project for further risk mitigation. The concept of "risk criticality" or the "highest risk path" is the probabilistic analog to the traditional critical path. It measures the percentage of time the task is on the critical path in the simulation by iteration.
The chart below describes how a CPM critical path that is highly managed may not be the path most likely to delay the project. In this schedule Path 2 is the CPM critical path and therefore well managed (narrow ranges are estimated). It turns out that it is only 15% likely to delay the project. The PM should focus risk management attention now on Path Three (45% likely to delay the project) and Path One (41%).
ADVANCED METHODS OF SCHEDULE RISK ANALYSIS
Advanced methods available with quantitative schedule risk analysis include probabilistic branching, correlation and conditional branching. These methods help model some more likely risk factors such as the possibility of failure, the correlation of task durations and the presence of contingency plans.
Probabilistic branching allows us to model the possibility of failing a test and having to fix the problem and retest. This is a common problem in many projects, including those attempting some technology for the first time. Usual schedules do not incorporate the possibility of failure, yet the tests are conducted precisely because they may fail. Dealing with schedules in a probabilistic way allows us to estimate the likelihood of failure and the impact on the schedule if the test is failed.
Suppose there is a single path schedule with a system test. Without thinking of the probability of failure the simulation will indicate some risk. Modeling the possibility of failure involves inserting one or more tasks that represent the string of actions - diagnose, plan the fix, implement the fix and retest. The durations of these tasks are uncertain. The data supporting this model include the likelihood of failure and the (uncertain) duration of diagnose, plan, fix and retest. These data are collected, as are those of the three-point estimates, through intensive interviews.
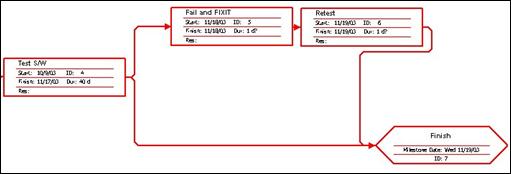
In the schedule below, notice the two new tasks, Fail and FIXIT and Retest. They are not given any duration in the baseline but they have ranges in the risk analysis. Test S/W has two successors, Fail and FIXIT and Finish representing failure and success of the Test S/W respectively. We know that the first, Fail and FIXIT will be taken only some fraction of the time as represented by the probability if failure gathered in interviews of project personnel and others. Notice we have place the probability of failure at 30% for this exercise.
The network diagram of this part of the schedule looks like this:
The results have a characteristic bi-modal distribution representing the likelihoods of success and of failure of the test. If there are several tests or if the FIXIT task it short or very broad the second mode may be blurred.
A comparison of the runs with and without the possibility of failing the test indicates the importance of including this risk in your analysis. The cumulative distribution or S-curve for the failure branch slopes dramatically after 70% as the failure possibility shows up. If there are several branches the "bend" in the S-curve shows up earlier, at the place of the sum of the failure probabilities. Even in this case, a conservative organization that chooses the 80th percentile will be vitally interested in a 70% likelihood of failure and may devise plans to make the system more robust to avoid it.
Correlation between Task Durations
Correlation is often found between activity durations when activities are influenced by a common risk factor. Advanced risk analysis investigates correlation and allows the analyst to specify the degree of correlation between durations. The probability distribution of completion dates is wider with correlation, indicating that correlated durations provide the possibility for both greater overruns and greater underruns (correlation does not favor overruns or underruns).
We will simulate this schedule twice, first without correlation and then with a high (.9) degree of correlation between all possible combinations of tasks. The results are presented side-by-side below. Notice the Standard deviation for the one on the left without correlation is 12.9 days while the one on the right with correlation is 22.1 days. This is the extra risk provided by correlation. Also notice that the 5% -- 95% ranges are 10/4 - 11/14 without correlation and 9/21 - 12/2 with high correlation.
The difference that correlation can make on both the high range and the low range distribution tails is shown below.
The normally understood approach to correlation is the Pearson product moment approach. I believe only one simulation product uses this method correlation and the others use Spearman rank order correlation. There is no clear relationship between the Spearman method and correlation as usually understood, Pearson.
Conditional Branching - Modeling the Contingency Plan
Conditional branching is a very powerful tool, useful in modeling many decisions including contingency planning, namely the rules for sticking with Plan A or going to Plan B. A contingency plan usually includes a "trigger" for its implementation, and the conditional statement is: "If A occurs, go to Plan B." We have a preferred technology (Alt. A) and an acceptable technology (Alt. B). Alt. A is new and therefore risky, and the customer does not want to commit to Alt. A if it jeopardizes the scheduled completion by too much.
The schedule below indicates that both Alternatives A and B need to be designed. The trigger is whether the design of Alt. A extends beyond September 21. The conditional statement is that if Design Alt. A finishes after 9/21, shift to Build and Test Alt. B.
First we need to simulate the schedule without the conditional branch to see what the impact on time is without a contingency plan in reserve. To do this we just zero out Task 8, Build and Test Alt. B and perform a simulation as if there is no Alt. B present. Then we re-install the full Alt. B including its risk and the conditional statement and rerun the analysis. A comparison of the results is below.
Notice that with the Contingency Plan B available, the schedule is not as risky. However, there is a cost, namely that the less-preferred technology, Alt. B is chosen 67% of the time (as indicated by the risk criticality index). These results are shown below:
The trade off between time and technology can be shown in a table. The tradeoff is clear. If the customer wants a different chance of Technology A, for instance a 50% chance, the date would be specified later
|
Scenario |
||
|
Measure of Schedule Risk |
No Plan B |
Plan B @ 9/21 |
|
Mean Date |
5/12 |
4/3 |
|
Probability 80% |
6/10 |
4/12 |
|
Probability Using Alt. A |
100% |
33% |
|
