AN AD-HOC TESTBED MONITORING WITH RRDTOOL
Ad-Hoc Testbed configuration
The Ad-Hoc
testbed includes 5 mobile nodes: 2
desktops, 2 laptops and one PDA with wireless LAN card (
Figure : Ad-Hoc Testbed configuration
RRDTool setup and configuration
a. Installing RRDTool
In each Ad-Hoc node we install an Apache server with the root address is: "/var/www/html". The latest version of RRDTool is available at: ftp://ftp.mirrors.wiretapped.net/pub/rrdtool/rrdtool-1.0.45.tar.gz
Copy the tarball into the "/usr/src" directory on wer linux box. From a command prompt, change into the "/usr/src" directory, and un-tar the tarball:
[email protected]# cd /usr/src
[email protected]# tar -xzvf rrdtool-1.0.45.tar.gz
Change into the newly created directory:
[email protected]# cd rrdtool-1.0.45
Compile and install RRDTool:
[email protected]# ./configure
[email protected]# make
[email protected]# make install
The default installation location is "/usr/local/rrdtool-1.0.48", so make some symbolic links to the executables:
[email protected]# ln -sf /usr/local/rrdtool-1.0.45/bin/rrdtool /usr/bin/rrdtool
[email protected]# ln -sf /usr/local/rrdtool-1.0.45/bin/rrdupdate /usr/bin/rrdupdate
[email protected]# ln -sf /usr/local/rrdtool-1.0.45/bin/rrdcgi /usr/bin/rrdcgi
The RRDTool Perl library simplifies things when using RRDTool from a Perl script, so to compile and install the Perl library for RRDTool:
[email protected]# make site-perl-install
Create a directory for RRDTool databases, and a directory for the web images which it'll generate:
[email protected]# mkdir /var/lib/rrd
[email protected]# mkdir /var/www/html/rrdtool
b. Getting Data
The first task is to determine how to obtain the data we want to insert into the RRD database. Some shell scripting can easily be used to obtain the items of information required. The statements below will return the SNR, signal, noise and rate respectively (assuming wer wireless interface is eth2).
[email protected]# iwconfig eth0|grep Quality|cut -d":" -f2|cut -d"/" -f1
[email protected]# iwconfig eth0|grep Signal|cut -d":" -f3|cut -d" " -f1
[email protected]# iwconfig eth0|grep Signal|cut -d":" -f4|cut -d" " -f1
[email protected]# iwconfig eth0|grep Rate|cut -d"M" -f1|cut -b20-24
Run these from a command prompt to verify they return the values expected.
c. Automating Data Collection
To automate data collection, we use a Perl script which performs the following tasks:
create RRD database
retrieve data
store data into the RRD database
generate daily, weekly, monthly and yearly graphs
The source code of this file is showed in appendix [2]. Then this file is copied to "/usr/local/bin/" and make it executable by changing the file permissions on it:
[email protected]# chmod 755 /usr/local/bin/rrd_wlan.pl
and adjust the settings defined at the top of the script to make them appropriate for wer linux box (and make sure these directories exist):
# define location of rrdtool databases
my $rrd = '/var/lib/rrd';
# define location of images
my $img = '/var/www/html/rrdtool';
The following lines in rrd_traffic.pl specify for which wireless network interfaces data will be collected. Add/modify/delete any lines here as appropriate (lines can be commented out with a "#" character).
# process data for each interface (add/delete as required)
&ProcessInterface("eth1", "MartinMast link");
The linux box I'm running this on has a single wireless interface, which is eth0. If we have more wireless interfaces, just duplicate the line shown above, and adjust the values as required.
Also specify the description of each interface. This description will be printed on the top of each graph generated by this script.
Test the script by executing it from a command prompt:
[email protected]# /usr/local/bin/rrd_wlan.pl
The first time the script is run, it'll create an RRD database for each interface, so we should see output similar to this (assuming the script has been configured to monitor eth1):
[email protected]# /usr/local/bin/rrd_wlan.pl
eth0 link stats: snr: 9 dB, signal: -94 dBm, noise: -103 dBm, rate: 2 Mbits/s
creating rrd database for eth0 interface...
On any subsequent executions, we should see similar output, but without the creating rrd database...... line.
Once we've verified the operation of the script, it can be automatically scheduled to run periodically. To get it to run every 5 minutes, add the following to "/etc/crontab":
# get wireless link details
*/5 * * * * root /usr/local/bin/rrd_wlan.pl > /dev/null
Note that if we find wer graphs are being created, but with no data, it's probably because wer cron paths aren't setup to include paths to all of the shell commands used in rrd_wlan.pl. To correct this, we'll have to either:
edit "/usr/local/bin/rrd_wlan.pl" to reference the full pathname for iwconfig, cut and grep, or edit the PATH definition in "/etc/crontab" to include the paths of those commands.
d. Viewing the Graphs
Each time the script is executed, if required, it'll update the graphs of SNR, signal, noise and the link rate. These graphs are being created in "/var/www/html/rrdtool/", and assuming we've got a webserver running, they'll be accessible via "https://192.168.120.2/rrdtool/". To provide a much cleaner way to view these graphs, we can develope a simple webpage for displaying all the daily trends, as well as displaying the daily, weekly, and yearly trends when a user clicks on one of the daily trends. We can save it as wlan.cgi file in directory: "/var/www/html/rrdtool/". Then make it executable by changing the file permissions on it:
[email protected]# chmod 755 /var/www/html/rrdtool/wlan.cgi
and adjust the settings defined at the top of the script to make them appropriate for wer linux box, in particular, the interface name:
# define the wireless interface
my $iface = 'eth0';
# get the server name (or we could hard code some description here)
my $svrname = $ENV;
e. Comments on Data Storage
This script uses a single RRD database to hold the SNR, signal, noise and link rate details for the wireless interface. The rrd_wlan.pl script uses the following syntax to create the RRD database:
rrdtool create /var/lib/rrd/weth0.rrd -s 300 \
DS:snr:GAUGE:600:0:60 \
DS:signal:GAUGE:600:-256:0 \
DS:noise:GAUGE:600:-256:0 \
DS:rate:GAUGE:600:0:100 \
RRA:AVERAGE:0.5:1:576 \
RRA:AVERAGE:0.5:6:672 \
RRA:AVERAGE:0.5:24:732 \
RRA:AVERAGE:0.5:144:1460
This will create an RRD database with the following attributes:
5 minute step (base interval with which data will be fed into the RRD), 4 data sources (snr, signal, noise, rate), 10 minute heartbeat for each data source
2 days of 5 minute averages
2 weeks of 1/2 hour averages
2 months of 2 hour averages
2 years of 12 hour averages
Monitoring results
In this report we shows the monitoring result at a relay nodes when it belong to a routing path of a MP3 streaming. This node has IP address is: 192.168.120.2 ( For showing the result we public it on the Internet via the address: https://220.69.183.102/RRDTool/)
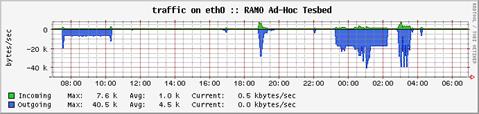
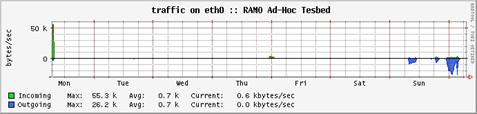
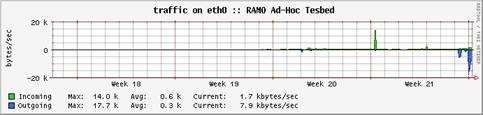
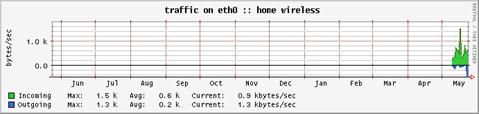
a. Forwarding traffic
Daily Graph (5 minute averages)
Weekly Graph (30 minute averages)
Monthly Graph (2 hour averages)
Yearly Graph (12 hour averages)
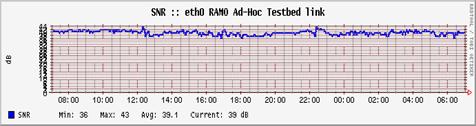
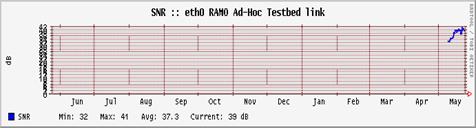
b. Signal to Noise Ratio
Daily Graph (5 minute averages)
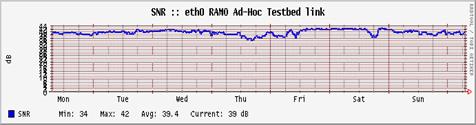
Weekly Graph (30 minute averages)
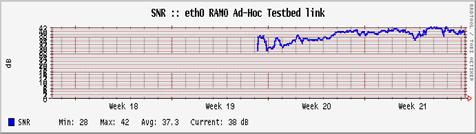
Monthly Graph (2 hour averages)
Yearly Graph (12 hour averages)
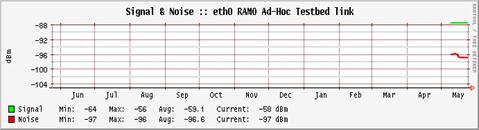
c. Signal and Noise
Daily Graph (5 minute averages)
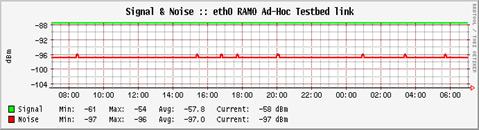
Weekly Graph (30 minute averages)
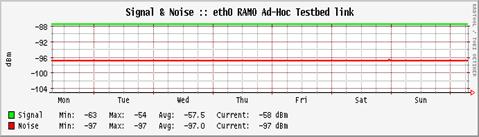
Monthly Graph (2 hour averages)

Yearly Graph (12 hour averages)
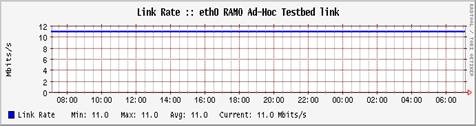
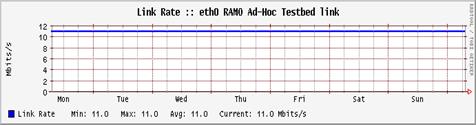
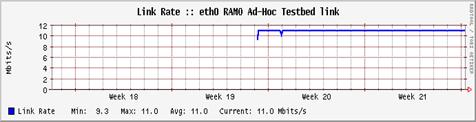
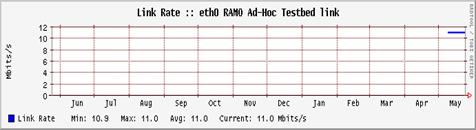
d. Link rate
Daily Graph (5 minute averages)
Weekly Graph (30 minute averages)
Monthly Graph (2 hour averages)
Yearly Graph (12 hour averages)
APPENDIX
[1] wlan_rrdtool.pl source code
|
#!/usr/bin/perl use RRDs; # define location of rrdtool databases my $rrd = '/var/lib/rrd'; # define location of images my $img = '/var/www/html/rrdtool'; # process data for each interface (add/delete as required) &ProcessInterface("eth0", "RAMO Ad-Hoc Testbed link"); sub ProcessInterface # insert values into rrd RRDs::update "$rrd/w$_[0].rrd", "-t", "snr:signal:noise:rate", "N:$snr:$signal:$noise:$rate"; # create traffic graphs &CreateGraphs($_[0], "day", $_[1]); &CreateGraphs($_[0], "week", $_[1]); &CreateGraphs($_[0], "month", $_[1]); &CreateGraphs($_[0], "year", $_[1]); sub CreateGraphs # generate signal/noise graph RRDs::graph "$img/$_[0]-sig-$_[1].png", "-s -1$_[1]", "-t", "Signal & Noise :: $_[0] $_[2]", "-h", "80", "-w", "600", "-a", "PNG", "-y", "2:2", "-l", "-105", "-u", "-88", "--rigid", "-v", "dBm", "DEF:signal=$rrd/w$_[0].rrd:signal:AVERAGE", "DEF:noise=$rrd/w$_[0].rrd:noise:AVERAGE", "LINE2:signal#11EE11:Signal", "GPRINT:signal:MIN: Min\\: %4.lf", "GPRINT:signal:MAX: Max\\: %4.lf", "GPRINT:signal:AVERAGE: Avg\\: %6.1lf", "GPRINT:signal:LAST: Current\\: %4.lf dBm\\n", "LINE2:noise#FF0000:Noise", "GPRINT:noise:MIN: Min\\: %4.lf", "GPRINT:noise:MAX: Max\\: %4.lf", "GPRINT:noise:AVERAGE: Avg\\: %6.1lf", "GPRINT:noise:LAST: Current\\: %4.lf dBm\\n"; if ($ERROR = RRDs::error) # generate link rate graph RRDs::graph "$img/$_[0]-rate-$_[1].png", "-s -1$_[1]", "-t", "Link Rate :: $_[0] $_[2]", "-h", "80", "-w", "600", "-a", "PNG", "-y", "2:1", "-l", "0", "-u", "12", "--rigid", "-v", "Mbits/s", "DEF:rate=$rrd/w$_[0].rrd:rate:AVERAGE", "LINE2:rate#0000FF:Link Rate", "GPRINT:rate:MIN: Min\\: %4.1lf", "GPRINT:rate:MAX: Max\\: %4.1lf", "GPRINT:rate:AVERAGE: Avg\\: %4.1lf", "GPRINT:rate:LAST: Current\\: %4.1lf Mbits/s\\n"; if ($ERROR = RRDs::error) |
[2] wlan.cgi source code
|
#!/usr/bin/perl # copyright Martin Pot 2003 # https://martybugs.net/wireless/rrdtool/ # wlan.cgi # define the wireless interface my $iface = 'eth0'; # get the server name (or we could hard code some description here) my $svrname = $ENV; my ($name, $descr); # get url parameters my @values = split(/&/, $ENV); foreach my $i (@values) # get the appropriate descriptive name if ($name eq '') elsif ($name eq $iface.'-snr') elsif ($name eq $iface.'-sig') elsif ($name eq $iface.'-rate') else print "Content-type: text/html;\n\n"; print <<END <html> <head> <TITLE>$svrname stats for $iface :: $descr</TITLE> < <META HTTP-EQUIV="Cache-Control" content="no-cache"> <META HTTP-EQUIV="Pragma" CONTENT="no-cache"> <style> body .header </style> </head> <body bgcolor="#ffffff" topMargin='5'> <span class='header'>$svrname stats for $iface :: $descr</span> <br><br> END if ($name eq 'error') elsif ($name eq '') else print <<END <br><br> <a href='https://ee-staff.ethz.ch/~oetiker/webtools/rrdtool/'> <img src='https://people.ee.ethz.ch/~oetiker/webtools/rrdtool/.pics/rrdtool.gif' border='0'></a> </body> </html> END |
|
