ALTE DOCUMENTE
|
||||||
THE
Zizi GOSCHIN, Daniela-L. CONSTANTIN, Monica ROMAN, Bogdan ILEANU
Abstract
The paper aims to highlight
the dynamics and current state of regional disparities in
JEL Classification
Key words: disparities, ranking,
concentration, region, county,
This paper is based on a research study elaborated by the authors for the Ministry of Development, Public Works and Housing, supporting the forthcoming regional policy-related decisions and actions.
"Inequality is like an elephant: You can't define it, but you know it when you see it"
(Fields 2001, 14)
1. Introduction
Economic regional disparities in the European Union moved upwards following the two last enlargements, although this effect is likely to diminish in time due to encouraging high dynamics of growth in the new member states, which is leading to a tendency towards narrowing the development gap.
The variation in the level and dynamics of disparities
among the regions in one country can diverge almost as widely as among regions
in different countries. The highest gap in dynamics is experienced by
Any attempt to explain the evolution of territorial inequalities
in
Narrowing or even closing the economic development gaps is one of the most complex and difficult issues in regional policy. In order to address this goal, policy makers need operative instruments of regional economic analysis, such as synthetic measures of territorial inequalities.
Starting
from these overall considerations we attempted to contribute to the existing
research with new statistical multidimensional measurements, focusing on recent
evolutions in
The remainder of this paper is organised as follows: section 2 gives a description of the statistical data and methodology employed in our research, section 3 presents the main results on the level and dynamics of the composite index of disparities and provides a regional typology based on economic inequalities, section 4 moves on to a related topic - the measuring of the territorial concentration for different economic variables, based on several statistical indicators. Our analysis is supplemented by a European study of regional economic performances, followed by summarising and conclusions in section 6.
2. Methodology
The territorial inequalities are the result of an uneven distribution of natural and human resources, the effect of many different economic, social, politic and demographic variables and of the way they spatially interconnect, and are also marked by the historic evolution of the regions. Consequently, the assessment of territorial disparities requires many data and information regarding various economic, social, political, cultural and geographical aspects that influence the development gaps.
There is a considerable literature devoted to inequality definition and measurement. Various concepts and categories are used, reflecting the broad coverage of the term. Three groups of relevant variables have been defined in order to cover the main forms of disparities, namely geographical, economic and social, from which the most common is GDP per inhabitant, largely accepted as a key variable of disparities.
Since each inequality criterion gives only partial information, there is a need for multidimensional statistical measures, as well as different statistical methods to work on data in order to understand and manage the complex development of the territorial units.
By adapting different statistical measures of variation to the specificity of spatial analyses, many indicators and techniques for territorial comparisons and ranking, as well as for inequality measurement, have resulted. Each one has its own advantages and limitation, and a specific utility that guides the choice of the best statistical methods to use for each empirical study.
Various variables have to be considered simultaneously in order to get a multidimensional characterisation and ranking of the territorial units in a country. One simple, yet powerful statistical technique that meets the needs of multidimensional comparisons is the relative distances ranking method. It combines different ranking criteria into one all-embracing hierarchy. Compared to other ranking methods it has the advantage that it also measures the relative distances (therefore inequalities) between the units for each one of the variables employed and combines them in one synthetic value. All these which makes the relative distances method a valuable multidimensional measure of disparities.
The specific of this method is the transformation of
the initial values of variables into relatives to the best value for each
criterion (variable). Therefore, for each variable (ranking criterion) j the
best placed unit ![]() is taken as a
reference base and relatives to it are computed for all others territorial
units i as:
is taken as a
reference base and relatives to it are computed for all others territorial
units i as:
![]() ,
,
where ![]() is the value unit of
variable j in the territorial i, and
is the value unit of
variable j in the territorial i, and ![]() stands for the best
value of variable j among the territorial units investigated (for most of the
ranking criteria it is the maximum value, but for variables such as the
unemployment rate it represents the minimum value). The ratio
stands for the best
value of variable j among the territorial units investigated (for most of the
ranking criteria it is the maximum value, but for variables such as the
unemployment rate it represents the minimum value). The ratio ![]() measures the relative distance of each territorial unit i to the
best performance for variable j. The same computation is repeated for every
ranking criteria j.
measures the relative distance of each territorial unit i to the
best performance for variable j. The same computation is repeated for every
ranking criteria j.
According to the methodology of the relative distances ranking, we further have to calculate the average relative distance of each unit i to the best performance as a simple geometric mean of the previous ratios for all the variables j:
 (1)
(1)
Finally the territorial units i can be ranked according to the decreasing value of the average relative distance Di. Since it results in a multicriterial measurement of relative distances, therefore disparities, between the territorial units, this simple, yet powerful method is suitable for the evaluation of spatial inequalities.
We have constructed a new variant of the relative distances ranking method adapted to our objective of multi-level analysis, so as to make it possible to measure simultaneously the intra and inter-regional disparities based on the same ratios (individual relative distances).
Economic disparities between the territorial units in
a region can be compared with the disparities inside other region only if there
is a common reference ground. The traditional method of relative distances does
not satisfy this requirement, so we decided to replace the best performance for a variable j (![]() ) by the average national value of that variable (
) by the average national value of that variable (![]() ), thus obtaining a new formula of the multicriterial
distance to the mean for every territorial unit i:
), thus obtaining a new formula of the multicriterial
distance to the mean for every territorial unit i:
 (2)
(2)
This way, regardless of the territorial perspective, we get a fixed position of each territorial unit, the individual distances relative to the mean enabling comparisons at different levels-national and regional. The disparities within and between regions now become comparable because they all share a common reference base -the national average. Moreover, relative distances above 1 indicate the developed counties/regions, while the values below 1 point to the territorial units in need for economic assistance.
The selection of the economic criteria for disparities measurement had to meet several conditions. We searched for variables which are synthetic, relevant for the analysis and spatially comparable (such as values per capita). Considering the goals of our research, and the limitations of statistical data available as well, we selected three main economic variables:
GDP per inhabitant, as a key measure of the development level;
the unemployment rate, as an essential indicator of the local labour market;
the average monthly net earnings, for its connection with the standard of living.
Thus, in order to measure the relative position of each territorial unit (both NUTS II and NUTS III level) and to establish a corresponding typology, a composite index has been built, taking into consideration GDP per capita, average earnings and unemployment rate.
Last but not the least, a problem to be solved refers to the different perspective upon best performance in the case of the unemployment rate. Unlike the other two variables selected, the lower the unemployment rate, the better the performance of a region/county. Formula (2) had to be adapted to this particularity by inverting the ratio for unemployment rate:
 , (3)
, (3)
where:
- Di is the composite index of disparities (the multicriterial distance to the national average for the territorial unit i);
-![]() ,
, ![]() and
and ![]() stand for GDP per
inhabitant, average monthly earnings and unemployment rate in the county/region
i;
stand for GDP per
inhabitant, average monthly earnings and unemployment rate in the county/region
i;
- ![]() ,
, ![]() and
and![]() are the national averages for GDP per inhabitant, average
monthly earnings and unemployment rate.
are the national averages for GDP per inhabitant, average
monthly earnings and unemployment rate.
Both individual and average disparities point to favourable positions when above the unit value and show negative situations when below 1.
3. Disparities between and within regions
3.1.Disparities between counties
Using the renewed relative distances method for the three selected variables we computed the composite index of disparities (relation 3) obtaining a multicriterial ranking of the Romanian counties displayed in figures 1 (2000) and 2 (2005).
As expected the
The second position is held by Ilfov county, placed by 46% above the average and the third one comes Bihor county (D=1,23).
After these three prominent counties, distances between successive positions get smaller, frequently being 2 or more counties on the same place, such as the fourth position held ex equo by Timis, Mures and Satu-Mare county (D=1,141).
Other
above average counties in 2000 were Arges,
There is a numerous group of counties below the average, but 10 of them are only by up to10% below the average national performance, which is not such a big disadvantage compared to the last ones in the hierarchy (such as Botosani and Vaslui).
The total
distance between extremes (maximum minus minimum relative performance) is
relatively high, reaching 112 percentage
points in 2000: 1,87 (
Figure 1. County ranking by the level of the composite index of disparities, 2000
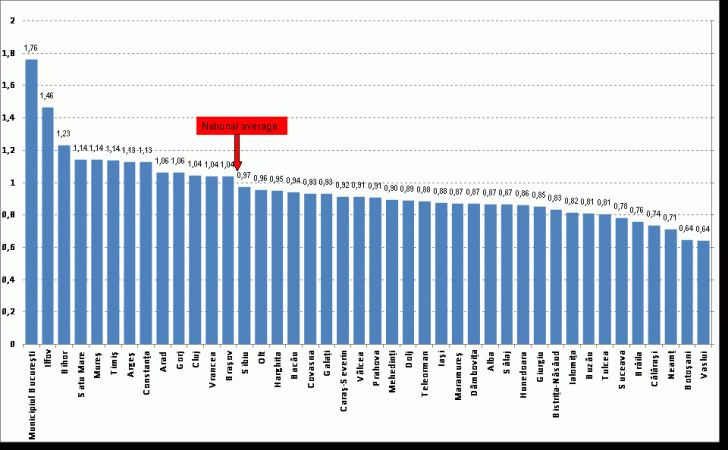
Sursa: calculele autorilor
Fig. 2 Ierarhizarea judetelor in anul 2005
Source: authors
Figure 2. County ranking by the level of the composite index of disparities, 2005
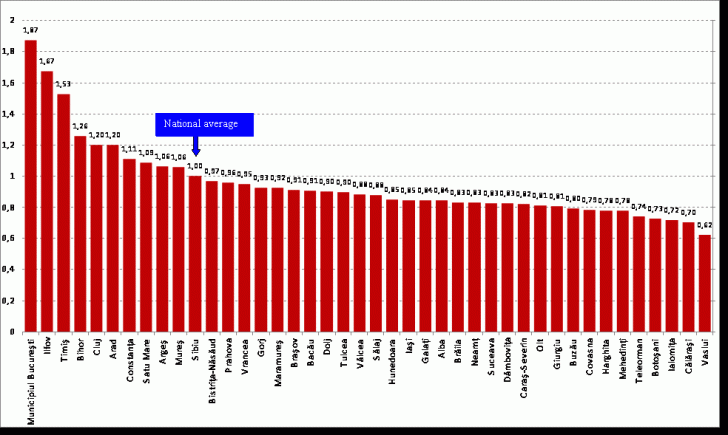
Sursa: calculele au
The year 2005 brought some changes in the hierarchy
(figure 2). The
Gorj,
Vrancea and
Vaslui county keeps the last position in 2005, while
Botosani advances by 9 pp. The
total distance between extremes rises by 13 pp compared to 2000, mainly owing
to the significant progresses of
3.2. A typology of multicriterial disparities
Based on the absolute level and dynamics of the composite index of disparities, the 41 Romanian counties plus Bucharest municipality have been divided into four groups, as follows: above average, on progress counties (improving their relative position); under average, on progress counties; above average, on decline counties (worsening their relative position); under average, on decline counties (figure 1, appendix).
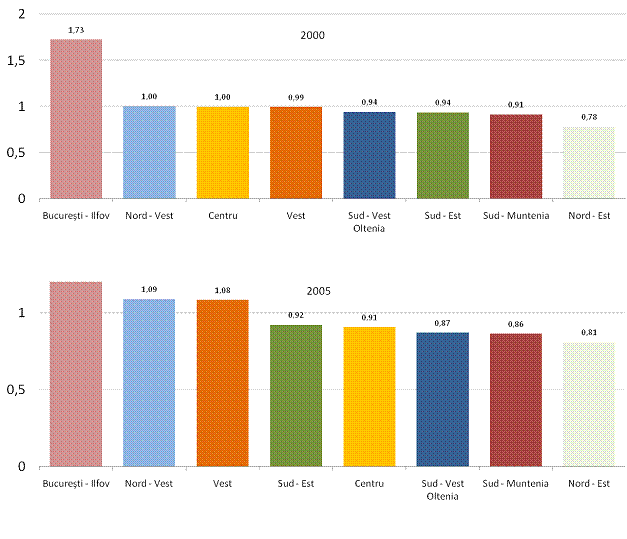
Disparities between regions
The data in table 1 depict the overall image of disparities by region from the perspective of the multicriterial measure of inequalities which reunites the three main economic variables: GDP per capita, average monthly net earnings and unemployment rate.
The regional ranking with respect to the national average in 2000 against 2005 displays stability at the extremes of the distribution, the first two places being held by the regions Bucharest-Ilfov and North-West, while the regions South and North-East have been constantly the last ones. The distance between the extreme positions (held by Bucharest-Ilfov and North-East regions) increased from 0,9478 (meaning 94,78% of the national average) to 1,0313 (103,13%) during 2000-2005, but is lower than the corresponding distance between the extreme counties.
Table 1. The composite index of disparities by region
|
Region |
Average composite index of disparities |
Dynamics of the composite index |
|
|
North-East | |||
|
South-East | |||
|
South | |||
|
South-West | |||
|
West | |||
|
North-West | |||
|
Center | |||
|
Bucharest-Ilfov | |||
Source: authors' computation.
Disparities within regions
The North-East region encompasses
some of the poorest counties in
The range of relative disparities is low within this region, except for unemployment rate (table 2) and the average composite index of disparities takes the smaller regional value in Romania (table 1).
Table 2. The range of relative disparities by region
|
Region |
The range of relative disparities
( |
|||||
|
GDP per inhabitant |
Average net earnings |
Unemployment rate |
||||
|
North-East | ||||||
|
South-East | ||||||
|
South | ||||||
|
South-West | ||||||
|
West | ||||||
|
North-West |
| |||||
|
Center | ||||||
|
Bucharest-Ilfov* | ||||||
Source: authors
* the results are not statisticaly significant
The South-East region is a relatively well developed region, slightly below the average performance (table 1). The separate analysis of disparities by variable gives a more complex image, with a wide range of economic performances of the counties and consequently displays large disparities. Constanta, which is situated above average for all the ranking criteria, represents the success story of the region, while other counties have lower but still satisfactory results (for instance, Galati in 2005), but there are also some poor, clearly underdeveloped counties (Tulcea, Braila, Buzau).
The South region -Muntenia- includes only one developed county - Arges, which continued its upward trend during 2000-2005, while Prahova is about the average and all other counties in the region are clearly under the average and on a declining trend.
In the South-West region -Oltenia- all the counties are placed under the national average, which explains the relatively low amplitude of economic disparities in this region. Inequalities slightly increased in 2005, compared to 2000, for GDP per capita and earnings, but sharply decreased for the unemployment rate.
The West region includes two developed
counties -Timis
and
The North-West region is
more polarised than other areas of the country: Cluj and Bihor counties are
well developed,
The counties
in the Center region all have good
values of GDP per capita, but serious problems of unemployment, excepting for
Mures. Even the most developed county in the region -
Clearly
the most developed region in
4. Concentration of economic activities
As
far as
Starting from the idea that Central and East European countries have experienced since 1990 increasing integration with the EU via trade and FDI the authors have aimed to identify and explain the economic effects of economic integration on patterns of regional specialisation. The research questions envisaged the changes in regional specialisation patterns since 1990, whether greater specialisation implies greater polarisation, to what extent relocation of manufacturing activities has taken place, the relationship between regional specialisation and growth. Besides specific features for various countries the overall conclusion has been the existence of a negative correlation between regional specialisation and regional GDP per capita and unemployment rates and the association of lower growth of regional GDP per capita with higher unemployment rates.
The impact of increasing economic integration with the EU on regional structural change and growth has been also analysed, highlighting the changes in regional specialisation patterns as well as the relationship between regional specialisation and growth (Traistaru, Iara, Pauna, 2002).
The question of regional specialisation has been analysed in national context too, mainly addressing the influence of transition, restructuring and privatisation on this process (e.g. Russu, 2001; Mitrut and Constantin, 2006; Andrei et al., 2007). The results highlight structural changes of a low significance to most of industries in the first ten years. These changes were determined by basic factors such as the removal of the COMECON market and the openness of foreign trade towards the EU countries as well as by temporary action-based factors, including political (e.g. the war in the former Yugoslavia) and economic (e.g. the raise of oil price) ones (Russu,2001). They supported the increase in the share of some industries unable to face competition forces (e.g. metallurgy) and disfavoured other industries, of high recovery and development potential in the future (e.g. machinery and electric appliances).
Territorial concentration of the economic activities is usually captured by the shares of the territorial units (regions or counties) in the total national value of each activity. Statistical measurement of the concentration implies dividing the volume of the economic activity j in the territorial unit i (Xij) by the total of activity j (Xj):
 , (4)
, (4)
where
![]() is the share of unit i
in activity j.
is the share of unit i
in activity j.
These ![]() shares are the
starting point for most of the statistical indicators of concentration. As far
as the variable employed is concerned, Xij has to be a synthetic
economic indicator, relevant for the specific goals of the analysis, but also
depending on the statistical data available at the territorial levels of
interest. The most common variables in the concentration analysis are GDP,
Gross Value Added, Gross Product, turnover, employment, the number of
employees, and gross capital formation. For the current analysis GDP, number of
employees and civil employment were chosen.
shares are the
starting point for most of the statistical indicators of concentration. As far
as the variable employed is concerned, Xij has to be a synthetic
economic indicator, relevant for the specific goals of the analysis, but also
depending on the statistical data available at the territorial levels of
interest. The most common variables in the concentration analysis are GDP,
Gross Value Added, Gross Product, turnover, employment, the number of
employees, and gross capital formation. For the current analysis GDP, number of
employees and civil employment were chosen.
The statistical methods for the measurement of concentration used in this paper are well known ones, namely Gini Inequality Index, Theil Index, and Herfindahl Index.
The Herfindahl Index was used for measuring the territorial concentration of each variable j (GDP, number of employees and civil employment) by summing the squared shares of the counties/regions i in the total volume of the variable considered at the economy level:
 . (5)
. (5)
The Herfindahl index is increasing with the degree of concentration, reaching its upper limit of 1 when the variable j is concentrated in one county/region. The lowest level of concentration is 1/n i.e. all counties/regions have equal shares in variable j. This means that the lower-bound of the Herfindahl Index is sensitive to the number of observations (counties), which is not a shortcoming for us since all computation were made for Romania only. Another limit of the indicator is due to the fact that the Herfindahl index is an absolute measure and big regions having larger shares mainly influence the changes in the concentration (the index is biased towards the larger regions).
The Theil Index measures the inequalities in the repartition of a variable x using the following formula:
![]() , (6)
, (6)
where:
![]() - the value of variable x in the territorial unit i;
- the value of variable x in the territorial unit i;
![]() - the arithmetic mean of variable x;
- the arithmetic mean of variable x;
n - the number of territorial units.
The values of the Theil Index range from 0 (meaning an even distribution) to ln n (maximum concentration).
The Gini Inequality Index was initially used to measure the earnings differentials, but was afterwards adapted to the requirements of the spatial analysis.
 , (7)
, (7)
where:
n- the number of territorial units;
xi - the increasing values of the variable considered.
Gini's values range from 0 (perfectly even distribution) to 1 (maximum concentration).
All the three indices presented above are indicating low levels of concentration and inequalities for the variables employed: GDP, number of employees and civil employment (table 3). Most of the values are close to the lower limit possible, which is 0 for the Gini and Theil indices and 0.125 for the Herfindahl Index, proving a small level of inequality.
Table 3. Statistical indicators of concentration and inequality between regions for GDP, number of employees and civil employment
|
GDP |
Number of employees |
Civil employment |
||||
|
Gini Index | ||||||
|
Theil Index | ||||||
|
Herfindahl Index | ||||||
Source: authors
The same statistical indicators of inequalities calculated within the regions, for GDP, number of employees and civil employment (table 3), showed higher levels of concencentration and disparity, although still limited to moderate values of these indicators.
Table 4. Statistical indicators of concentration and inequality within each region for GDP, number of employees and civil employment
|
Herfindahl Index |
Gini Index |
Theil Index |
Herfindahl Index |
Gini Index |
Theil Index |
|||||
|
1. North- East | ||||||||||
|
GDP | ||||||||||
|
Number of employees | ||||||||||
|
Civil employment | ||||||||||
|
2. South-East | ||||||||||
|
GDP | ||||||||||
|
Number of employees | ||||||||||
|
Civil employment | ||||||||||
|
3. | ||||||||||
|
GDP | ||||||||||
|
Number of employees | ||||||||||
|
Civil employment | ||||||||||
|
4. South-West Oltenia | ||||||||||
|
GDP | ||||||||||
|
Number of employees | ||||||||||
|
Civil employment | ||||||||||
|
5. West | ||||||||||
|
GDP | ||||||||||
|
Number of employees | ||||||||||
|
Civil employment |
| |||||||||
|
6. Nord Vest | ||||||||||
|
GDP | ||||||||||
|
Number of employees | ||||||||||
|
Civil employment | ||||||||||
|
7. Center | ||||||||||
|
GDP | ||||||||||
|
Number of employees | ||||||||||
|
Civil employment | ||||||||||
|
8. Bucharest- Ilfov* | ||||||||||
Source: authors
* the results are not statisticaly significant
5. Romanian regions from a European perspective
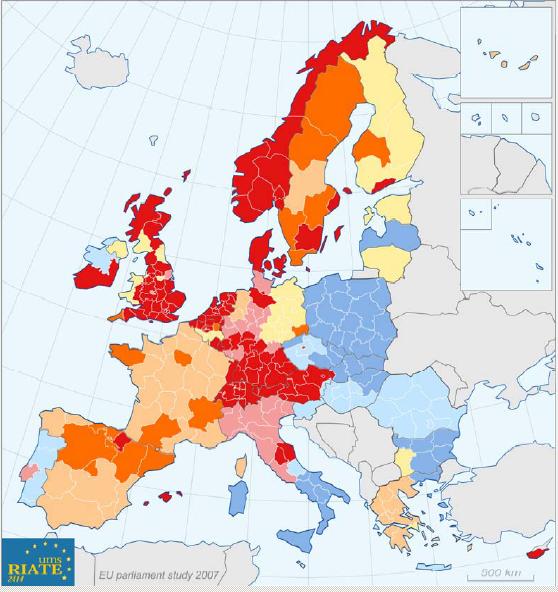
Our analysis of Romanian regions is further supplemented with a European perspective. A hierarchical cluster analysis (European Parliament, 2007) for the 268 regions in the EU-27 places Romanian regions in the group of the most lagging regions in Europe but with the advantage of a relatively low level of unemployment rate. The study establishes 7 main types of regions (Map 1, Appendix) each group being defined by some specific characteristics.
. Type Low-1, which includes regions in
. Type Low-2 is very similar to previous type Low-1 but with the advantage of a relatively low level of unemployment rate. However the performance is smaller for indicators such as education or life expectancy.
. Type Medium-1 is characteristic to regions with low-medium situations across all criteria except education. Displaying better levels of highly skilled labour force, these regions could base their future development on this specific advantage.
. Type Medium-2 is also characteristic to regions with a medium situation in respect of GDP per capita and education, higher levels of life expectancy, but specific weakness relating to employment. They should therefore focus on the reduction of unemployment without diminishing the lipseste un cuvant of social provisions indirectly revealed by the good life expectancy.
. Type Medium-3 is comprising regions which are generally considered as being "without problems" as they have high levels of GDP per capita and relatively small unemployment. These regions are characterised by rather poor performances in respect of life expectancy and the share of people with a high level of education. Regional policy here should therefore focus mainly on the development of infrastructures for health and education.
. Type High-1 includes regions with good global performance on all criteria, except employment, higher than the EU average. These regions can generally rely on good social conditions relatively high economic competitiveness. As in the case of type Medium-2 regions, their problem is how to reduce unemployment without breaking the good level of performance in respect of the other criteria.
. Type High-2 also displays good global performance on all criteria but with some differences as compared to type High-1. The situation is clearly better in terms low levels of unemployment and slightly better in terms of GDP per capita. Performance levels are less good than type High-1 however in respect of life expectancy and education.
![]()
6. Summary and conclusions
In this paper we have constructed a new variant of the relative distances ranking method adapted to the objective of our study, so as to make it possible to measure simultaneously the intra and inter-regional disparities. Thus, in order to measure the relative position of each territorial unit (both NUTS II and NUTS III level) and to establish a corresponding typology, a composite index has been built, taking into consideration GDP per capita, average net monthly earnings and unemployment rate.
Based on this index absolute level and dynamics, the 41 Romanian counties plus Bucharest municipality have been divided into four groups, as follows: above average, on progress counties (improving their relative position); under average, on progress counties; above average, on decline counties (worsening their relative position); under average, on decline counties.
Gini index, Herfindahl index and Theil index have been also employed, showing a low level of concentration, which suggests a low amplitude of both inter-regional and intra-regional disparities, although, the intra-regional disparities are much higher than the inter-regional disparities.
Nevertheless, even the most developed region, Bucharest-Ilfov, has the GDP per capita less than 75% of the EU average, so that all Romanian development regions are eligible under the Convergence objective. This conclusion supports the need to analyse regional disparities both in relative and absolute terms and not only at national scale but also compared to the EU average.
References and bibliography
Andrei. T., Iacob. A., Vlad, L. (2007), "Tendencies in the Romania's Regional Economic Development during the Period 1991-2004", in Economic Computation and Economic Cybernetics Studies and Research, No. 1-2, vol.41, p. 107-120
Atkinson, A.B. (1970) "On the Measurement of Inequality", Journal of Economic Theory, 2 (3): p. 244-263.
Atkinson, A. B., and A. Brandolini. (2004), "Global World Inequality: Absolute, relative or Intermediate?" presented at the 28th General Conference of The International Association for Research in Income and Wealth, August 22-28, Cork, Ireland.
Constantin, D.L.,
Goschin, Z., Dragan, G.(2008), "Implications of the EU Structural Assistance to the
New Member States on Regional Disparities. The Question Of Absorption Capacity", International
Workshop on Regional Endogenous Development: Measurement, Models and Empirical Investigation,
The
Fields, G. S. (2001), Distribution
and development : a new look at the developing world,
Goschin Z., Danciu, A.,
Gruiescu, M. (2008), "Regional
Disparities of Economic Growth in the Enlarged European Union", Analele Universitatii din
Goschin Z. (2008), Disparitati regionale în România, p.64-70, Regional Disparities in Romania, Revista Româna de Statistica, nr.1, p. 71-77, www.revistadestatistica.ro
Kanbur (2004) "Growth, inequality, and Poverty: some hard questions" at www.people.cornell.eduy/pages/sk145
Maasoumi, E. (1986), "The Measurement and Decomposition of Multi-Dimensional Inequality", Econometrica 54.
Mitrut, C., Constantin, D.L., "Current Issues Concerning Regional Policy and SMEs in Romania", in South-Eastern Journal of Economics, Vol. 4, No.2, Fall 2006, p. 209-222, University of Macedonia Press, Thessaloniki
Pascariu, G., Stanculescu, M.,
Jula, D., Lutas, M. (2002), "EU cohesion Policy and
Russu, C. (2001), "
Sen, A. K., and J. E. Foster (1997), On economic inequality,
Shorrocks, A. F. (1980): "The Class of Additively Decomposable Inequality Measures", Econometrica 48.
Stewart, F. (2001), "Horizontal Inequalities: A
Neglected Dimension of Development", CRISE Working Paper 1, Centre
for Research on Inequality, Human Security and Ethnicity (CRISE) and Queen
Elizabeth House (QEH), University of
Traistaru, I., Iara, A., Pauna, C., (2002), "Regional structural change and growth in Romania ",
paper presented at the 42nd congress of the European Regional Science
Association,
Traistaru,
*** Anuarul statistic al României, INS, Bucuresti.
*** Statistica teritoriala, INS, Bucuresti, 2007.
*** Green
Paper. Regional Development Policy in
*** Geographic Concentration and Territorial Disparity in OECD Countries, OECD, 2003.
https://www.inforegio.cec.eu.int
https://www.europa.eu.int/comm/regional.policy
APPENDIX
Composite index 2005 Disparities dynamics 2000-2005
![]() Figure 1. The level of the composite index in
2005 and its dynamics 2000-2005
Figure 1. The level of the composite index in
2005 and its dynamics 2000-2005
Source: authors
Table 1. The composite index of disparities for the counties in North-East
|
The composite index of disparities |
Dynamics |
||
|
North-East | |||
|
| |||
|
Botosani | |||
|
| |||
|
Neamt | |||
|
Suceava | |||
|
Vaslui | |||
Source: authors' computation
Table 2. The composite index of disparities for the counties in South-East
|
The composite index of disparities |
Dynamics |
||
|
South-East | |||
|
| |||
|
| |||
|
| |||
|
| |||
|
Tulcea | |||
|
Vrancea | |||
Source: authors' computation
Table 3. The composite index of disparities for the counties in South- Muntenia
|
The composite index of disparities |
Dynamics |
||
|
| |||
|
South- Muntenia | |||
|
Arges | |||
|
Calarasi | |||
|
Dâmbovita | |||
|
| |||
|
Ialomita | |||
|
Prahova | |||
|
Teleorman | |||
Source: authors' computation
Table 4. The composite index of disparities for the counties in South-West Oltenia
|
The composite index of disparities |
Dynamics |
||
|
South-West Oltenia | |||
|
Dolj | |||
|
Gorj | |||
|
Mehedinti | |||
|
Olt | |||
|
Vâlcea | |||
Source: authors' computation
Table 5. The composite index of disparities for the counties in West
|
The composite index of disparities |
Dynamics |
||
|
West | |||
|
| |||
|
Caras-Severin | |||
|
Hunedoara | |||
|
Timis | |||
Source: authors' computation
Table 6. The composite index of disparities for the counties in North-West
|
The composite index of disparities |
Dynamics |
||
|
North-West | |||
|
Bihor | |||
|
Bistrita-Nasaud | |||
|
Cluj | |||
|
Maramures | |||
|
Satu Mare | |||
|
Salaj | |||
Source: authors' computation
Table 7. The composite index of disparities for the counties in Center
|
The composite index of disparities |
Dynamics |
||
|
Center | |||
|
Alba | |||
|
| |||
|
Covasna | |||
|
Harghita | |||
|
Mures | |||
|
| |||
Source: authors' computation
Table 8. The composite index of disparities for the counties in Bucharest-Ilfov
|
The composite index of disparities |
Dynamics |
||
|
| |||
|
Ilfov | |||
|
Municipiul Bucuresti | |||
Source: authors' computation
Figure 2. The level of the composite index of disparities by region, 2000 and 2005
Source: authors
Map 1. Typology of performance of the EU-27 regions in 2000
Source: European Parliament, 2007

|
