INFLUENCE OF
DIFFERENT FORMS OF BACKERY'S YEAST SACCHAROMYCES CEREVISIAE TYPE
Abstract
Research was conducted about the dynamics of the fermentation of the carbohydrates in the dough by three commercial forms of yeast Saccharomyces cerevisiae type produced by S.C. Rompak S.A. Pascani Romania (compressed yeast, instant active dry yeast, active dry yeast) at 0, 60, 120 and 180 minutes of dough fermentation. Experiments were performed using high-performance chromatography for analysis of sugars during dough fermentation. Also a Chopin rheofermentometer was used to analyze gas production and dough height. At HPLC a variation of the quantity of sugars was remarked on the entire duration of the fermentation depending on the form of the yeast used in the following ascending order: dry instant active yeast > compressed yeast > dry active yeast. From the point of view of the results obtained by Chopin rheofermentometer device, it was observed that the dough fermented with the compressed yeast has the highest released quantities of carbon dioxide.
Keywords: compressed yeast, instant active dry yeast, active dry yeast, dough fermentation, HPLC, Chopin rheofermentometer
Introduction
The yeast used for bread manufacture is Saccharomyces cerevisiae, often referred to as simply bakers' yeast. Yeast growth is initiated as soon as the flour, water, yeasts, and other ingredients are combined and the dough is adequately mixed. A lag phase usually occurs, the duration of which depends on the form of the yeast and the availability of fermentable sugars which are formed from the carbohydrates of the flour and from maltose formed amilolitic. Henry R.J. and Saini H.S. consider that the most important carbohydrates from the flour with an effect over the loaf volume are glucose, fructose and sucrose. The order in which these different carbohydrates are fermented by Saccharomyces cerevisiae is not random, but rather is based on a specific hierarchy, with glucose being the preferred sugar. It seems that glucose slows down the uptake of fructose because both sugars are imported by the same carriers, which have a greater affinity for glucose than for fructose [9].
From mentioned carbohydrates sucrose is converted almost immediately to glucose and fructose, because of the potent invertase of yeast [7]. While the concentration of glucose and fructose is big enough, the concentration of maltose from the dough is increasing because amylase, a starch degrading enzyme in flour, is constantly generating new glucose and maltose from flour starch. When the glucose and the fructose are finished, the concentration of maltose is starting to decrease which makes it difficult for the yeast cells which don't have the necessary enzymatic equipment for its hydrolysis.
Over time, working methods and techniques applied in the study of carbohydrate variation were improved, to increase the accuracy of performed determinations. There were conducted determinations using layer chromatography (Ponte et. al. 1969, Henry et. al., 1989, Shieh et. al. 1973) trough ion-exchange chromatography (Abou-Guendia et. al, 1972), and in nowdays the most of the investigations are done using the HPLC system (Potus et. al. 1994, Sahlstrom S., 2003, Langemeier et. al. 1995). To our knowledge, no report has stressed the importance on fermentation time at different forms of yeast Saccharomyces cerevisiaes strain on the sugar content of dough using HPLC system.
The purpose of this study was to investigate how the different forms of bakery yeast Saccharomyces cerevisiae type and the fermentation time can affect the mono- and disaccharide concentration determined using the HPLC system and gas production using Chopin rheofermentometer device.
Material and Methods
Materials. Commercial wheat flour (harvest 2008) was milled on an experimental Buhler mill from S.C. Vel Pitar S.A. Valcea. Flour quality tests, which were accomplished according to Romanian, or international standard methods, indicated the following values: ash content 0.47%, wet gluten content 26.5%, gluten deformation 6mm, protein content 11.46%, fat content 1.5%, sugar content 75.27%, falling number 404sec, farinograph data - water absorption WA 56.9%, development 2.3min, stability 5.8min, weakening 84BU, flour strength 65, alveogrpah data - tenacity 91 mm H2O, extensibility 45 mm, index of swelling 14.9, baking strength 156, configuration ratio of the curve 2.02.
The yeast used in this study was Saccharomyces cerevisiae type made by S.C. Rompak S.A Romania in three different commercial forms: compressed yeast, instant active dry yeast, active dry yeast. Some analyses of these yeasts are given in table 1. Fructose, glucose, sucrose, and maltose (Merck) were used without further purification.
Table 1
Protein content, humidity and measured volumes of liberated CO2 during 1h, 2hrs and total of fermentation of dough
|
Characteristics |
Compressed yeast |
Instant active dry yeast |
Active dry yeast |
|
Humidity % |
67.48 |
4.5 |
6.5 |
|
Protein content % |
40 |
42 |
42 |
|
Measured volumes of liberated CO2 during 1h, 2hrs and total of fermentation of dough |
740/1190/1930 |
1000 |
1000 |
Mixing conditions. Dough recipe comprised flour, water (accord. WA, %), 3% yeast (% flour basis) and 1.5% salt (% flour basis). Instant and active dry yeast was rehydrated before mixing. The dough was kneaded 15 minutes and after it was fermented 180 minutes at 30˚C temperature and 80% relative humidity. During the fermentation period, two re-kneadings were done at 60 minutes of 30 second each. Analyses were performed before the insertion in the proofing device and after one hour of fermentation, two hours of fermentation and three hours of fermentation.
Sugar extraction. Firstly 10 g of the dough sample were boiled for 20 min in 100 ml of 60% ethanol. After the cooling phase, the sample was centrifuged 15 minutes at a speed of 4000 rotations / minute. The supernanatan is concentrated afterwards at the vacuum pump, after which it is filtered using Whatman 42 paper. Additionally, the filtered material it is passed through a filtering membrane of 0.22μm before the injection into the HPLC system. Chromatographic determinations were achieved in a HPLC system with the following operating conditions: column -Waters with aminopropyl-bonded phase -C18, 250 mm x 4.6 mm, 4 μm particle diameter; eluent - acetonitrile : water solution (with sodium chloride added of 0.125%w/v to minimize the interference from NaCl) = 75 : 25; flow rate 1 ml/min; temperature 30°C; injected volume 20 μl. An Alltec refractive index detector was used. Sugar concentration was calculated based on peak area measurements. The retention times in the column of the sugars where: fructose - 5 min; glucose - 5.8 min; sucrose - 8.2 min; maltose - 9.8 min.
Measurement of gas production and dough development. The fermentation behavior of the flours was analyzed at different fermentation time 30, 60, 90, 120, 150, 180 min using the Chopin rheofermentometer. Total volume of gas production (ml/g) and dough height (mm) under stress of 1.25 kg were automatically determined.
Results and Discussions
The quantitative analysis of sugars in the flours. The concentrations of soluble mono- and disaccharides in flours are (in decreasing order): sucrose (2.47 mg/g), maltose (0.49mg/g), fructose (0.42mg/g) and glucose (0.33mg/g). These values are in agreement with those reported by others (Abou -Guendia et al 1972, MacArthur et al 1976, Potus et al. 1994, Shalstrom et al 2003).
Effect of yeast and fermentation time on dough sugar content. The amount of fermentable sugars during of the course of the dough fermentation by three different commercial forms of bakers' yeast is shown in table 2.
Table 2
The variation of the concentration of the fermentable carbohydrates during the dough fermentation
|
The analyzed sample |
Fermentation time (min) |
Sucrose mg/g dough |
Glucose mg/g dough |
Fructose mg/g dough |
Maltose mg/g dough |
|
Dough produced with compressed yeast |
0 |
- |
1,56 |
5,54 |
8,43 |
|
60 |
- |
3,09 |
4,21 |
12,32 |
|
|
120 |
- |
0,14 |
0,92 |
15,82 |
|
|
180 |
- |
0,31 |
0,48 |
8,86 |
|
|
Dough produced with instant dry yeast |
0 |
- |
0,86 |
5,03 |
9,64 |
|
60 |
- |
1,63 |
3,86 |
15,08 |
|
|
120 |
- |
0,74 |
1.02 |
17,52 |
|
|
180 |
- |
0,56 |
0,88 |
9,56 |
|
|
Dough produced with active dry yeast |
0 |
- |
1,64 |
5,32 |
7,21 |
|
60 |
- |
0,31 |
2,75 |
14,05 |
|
|
120 |
- |
0,20 |
1,64 |
16,34 |
|
|
180 |
- |
- |
0,21 |
7,13 |
It can be seen that sucrose has not been identified in the dough after kneading for none of the analyzed samples which is in agreement of the results of Potus et al 1994, Langemeir et al 1995. This is due to the presence of a very active invertase in the yeast which inverts the sucrose from the flour into glucose and fructose during the kneading phase. Therefore, in almost all the cases, at the beginning of the fermentation phase, there have been detected higher levels for these carbohydrates than the ones from the flour. While the concentration of glucose and fructose is highly enough, the concentration of maltose from the dough increases (with a higher rate in the first hour of fermentation and a lower one in the second hour of fermentation) and only when the other sugars are exhausted the concentration of maltose is starting to decrease. In the first hour of fermentation, the production of sugars by amilolitic means overcomes the consumption in the fermentation process, therefore the content of sugars increases. In the following hours, the content of reducing sugars decreases, because of their intense consumption by the yeast. The quantity of sugars throughout the entire dough fermentation varies with the forms of the yeast used in the following ascending order: instant active dry yeast > compressed yeast > active dry yeast. Thus, at the end of the fermentation process, there has been registered with 31.4% more sugars for the compressed yeast and with 49.8% sugars for the instant dry yeast in the dough, over the active dry yeast. Likewise, after 180 minutes of fermentation, the dough prepared using active dry yeast is the only one which no longer contains glucose, fact which leads to the conclusion that this yeast has a high fermentation rate.
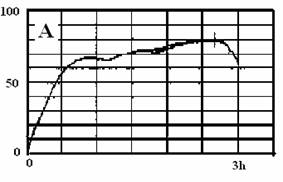
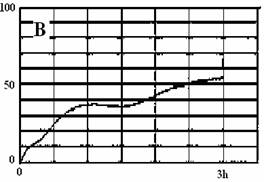
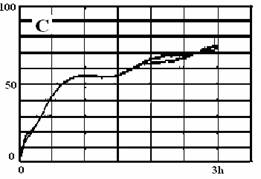
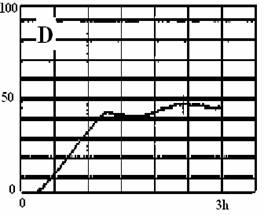
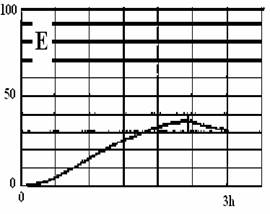
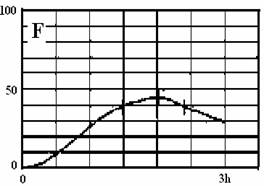
Effect of yeast and fermentation time on gas production measurement and dough development. The fermentation activity of the yeast expressed through the emission of carbon dioxide (figure 1) shows that this activity is more intense for the dough prepared with the compressed yeast which registered a volume of gas with 79.09% higher than the one for the dough prepared using instant dry yeast and with 19.04% higher for the dough prepared using active dry yeast. Likewise, the value obtained for the maximum height of the dough (figure 2) was correlated with the quantity of carbon dioxide that was released, the highest value obtained was registered also for the compressed yeast.
|
|
|
|
|
|
Figure 1. Gas release to Chopin rheofermentometer for: A-compressed yeast, B-instant dry yeast, C-active dry yeast
|
|
|
|
|
|
Figure 2. Development of the dough to Chopin rheofermentometer for: D-compressed yeast, E-instant dry yeast, F-active dry yeast
From the point of view of the quantities of carbon dioxide registered during the fermentation, there is a correspondence between the curves registered at the Chopin rheofermentometer and the quantity of the formed carbohydrates. In figure 3 it can be observed that for the active dry yeast and for the active instant dry yeast the minimum is registered in the fermentation interval 1-1.5h which corresponds with the transition from the glucose fermentation to fructose fermentation. In the case of the dough prepared using the compressed yeast, the minimum of carbon dioxide emission is registered in the fermentation interval 2.5-3h, moment which corresponds to the transition to an incomplete activation of maltose in the dough system.
Figure 3. The variation of the gas volume during the fermentation measured with the Chopin rheofermentometer
Conclusions
While tracking the fermentation of the dough prepared with different commercial forms of Saccharomyces cerevisiae yeast during 3 hours, it was observed that in the first hour the content of sugars from the dough increases, then in the interval 1-2 hours the glucose and fructose ferments, and in the interval 2-3 hours especially the fructose and maltose ferment. The fermentation of the maltose up to the exhaustion of the sucrose and fructose is reduced. It begins to ferment actively after 2 hours of fermentation. It was observed that the highest fermentation rate it is present at the active dry yeast followed by the compressed yeast and by the active instant dry yeast. The formation of gases in the dough describes a curve which presents at a certain moment a minimum. This minimum corresponds to the moment of transition from the fermentation of glucose to the fermentation of fructose in the case of active dry yeast and the instant active dry yeast, and to the transition from the fermentation of glucose and fructose to the fermentation with a considerable rate of maltose in the case of the compressed yeast. From the point of view of the quantities of carbon dioxide released, the highest values were registered at the compressed yeast following the instant dry yeast and the active instant dry yeast which indicates that the compressed yeast presents the most intensive fermentative activity from the three commercial forms of yeast analyzed.
Contrary to the expectations, from the three forms of yeast analyzed, the active dry yeast most easily adapts to the fermentation of the sugars, and the compressed yeast presents the highest fermentation activity.
References
1. Abou-Guendia, M., D'Appolonia, B.L., 1972, Changes in carbohydrate components during wheat maturation. I. Changes un free sugars, Cereal Chemistry, 49:664-676
2. Langemeier, J.M., Rogers, D.E., 1995, Rapid method for sugar analysis of doughs and baked products, Cereal Chemistry, 72(4):349-351
3. Henry, R.J., Saini, H.S., 1989, Characterization of cereal sugars and oligosaccharides, Cereal Cehmistry 66(5): 362-365
4. Hutkins, R.W., 2006, Microbiology and Technology of Fermented Foods Blackwell Publishing, IFT press, pp.276-282
5. Ponte, J.G., De Stefanis, V.A., Titcomb, S.T., 1969, Application of thin-layer chromatography to sugar analysis in cereal-based products. (Abstr. No.100), Cereal Science Today 14: 101
6. Potus, J.,, Poiffait, A., Drapron, R., 1994, Influence of dough-making conditions on the concentration of individual sugars and their utilization fermentation, Cereal Chemistry, 71 (5): 505-508
7. Sahlstrom, S., Park, W., Shelton, D.R., 2003, Factors influencing yeast fermentation and the effect of LMW sugars and yeast fermentation on hearth bread quality, Cereal Chemistry, 81 (3): 328-335
8. Shieh, K.K., Donnelly, J., Scallet, B.L., 1973, Reaction of oligosaccharides. IV. Fermentability by yeasts, Cereal Chemistry 169-175
9. Verstrepen, K.J., Iserentant, D., Malcorps, P., Derdelinckx, G., Van Dijck, P., Winderickx, J., Pretorius I.S., Glucose and sucrose: hazardous fast-food for industrial yeast?, Trends in Biotechnology 22(10): 531-537
|