Module 3
Table of Contents
Overview
Initial Situation
Analysis of the initial situation
Dimension analysis
Used TM1 functions
Save an application
New cubes
Sales
TOP 10 Gross Margin%
Bottom 5 Price
TOP Sum Units
Bottom Sum Units
TopPercent Sales 80%
BottomPercent Gross Margin 20%
Dimension order
P&L5D
View Total
New dimensions
Processes
2.4.1. Process: Cub_sales_zero_out
Chores
Trace calculation
Importing Data with Excel
Import_P&L5D
3.1.1. Reading in example data
The most important Excel TM1 Worksheet Functions
DBR
TM1 functions
Twoviews
Balance
Sending attributes with Excel in TM1:
4.3.1. Add the attribute Monat
4.3.2. Transfer attributes from month to Month_C
Applications
Access to relational data
Drill Through
Rollup
Creating User-defined Consolidations on the Fly
ODBC Access to relational data
Creating Dimension Pictures
5.1.4 Assigning the Dimensions
5.1.5. Defining the Consolidations
5.1.7. Checking the new dimension
Creating Dimension ZIP
5.2.4. Assigning the Variables
5.2.5. Assigning Consolidations
Creating Cube Tour
5.3.5. Saving and Executing Cub_Tour
5.3.7.View: Units_Cinema_Kirche_Park
Overview
In this module you learn how to import a large amount of data via Excel or the Turbo Integrator (TI) into TM1. We will also expand our basic knowledge.
We have prepared the following initial situation:
Analysis of the initial situation
Get a general idea.
Dimensions can be analyzed both in the Subset Editor and in Excel. We have prepared the following small tool to make this analysis comfortable. Open the file Dimensionanalysis.xls.
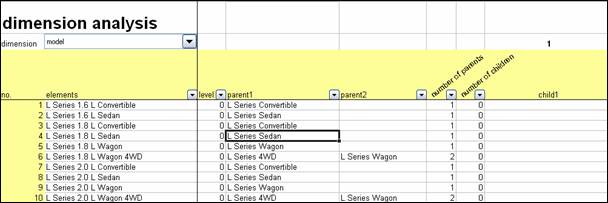
The selection in cell B2 enables you to choose different dimensions.
The following functions are used to analyze the dimensions:
=DIMNM($B$2;$A4)
. gives back the dimension element with the indicated index number.
=DIMIX($B$2;B4)
. gives back the index number from the dimension element, which is indicated in
the cell B4.
=ELLEV($B$2;B4)
. indicates the hierarchic level where the element is situated.
=ELPAR($B$2;$B4;1)
. indicates the parent element from the element in B4.
=ELPARN($B$2;B4) . indicates the number of the parent elements.
=ELCOMPN($B$2;B4) . indicates the number of the child elements.
=ELCOMP($B$2;B4;1)
. indicates the child element from the element that is selected in B4.
You can find out more about these functions in the Applix TM1 Client Manual, in TM1 Help or under Insert Excel functions (TM1).
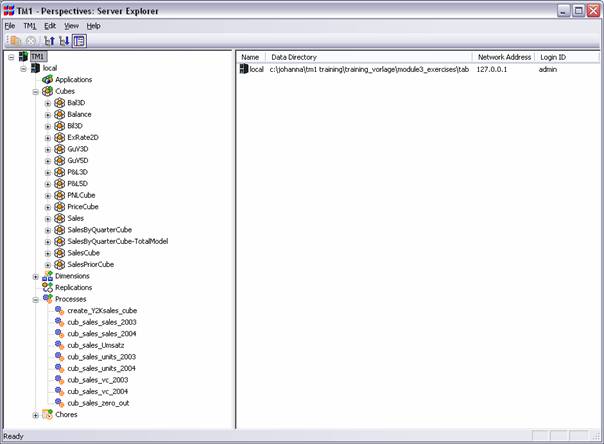
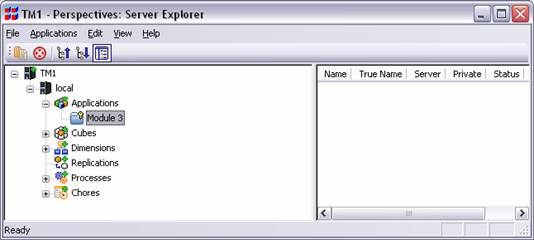
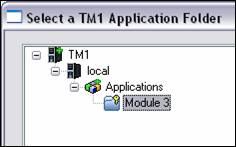
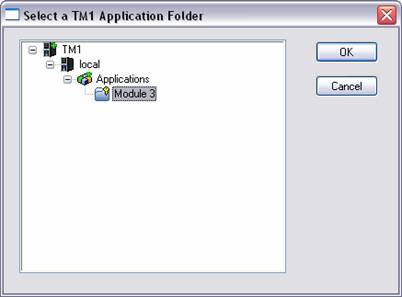
You can save this analysis worksheet as TM1 application. Create a new application folder. Therefore open the TM1 Server Explorer, click with the right mouse key on Applications, and then on Create New Application. Name the folder Module 3.
There are two main possibilities to save a file in the system:
a)
Select via
the TM1-menu: Save Workbook on TM1 Server/ Upload new Application File to TM1 Server or
click on ![]() .
With this method the file is loaded onto the server and is accessible, even if
the source-file is destroyed.
.
With this method the file is loaded onto the server and is accessible, even if
the source-file is destroyed.
b) Select the folder where to save the application and choose Applications/Add File from the context menu. Doing so only a reference is created. If the source-file is deleted, the file is no more addressable and callable.
Return to Excel and click on the following icon ![]() .
.
The following display appears:

Click on Module 3 and press OK. The Excel sheet has been saved as an application in TM1.
What is the difference between the Sales and the SalesCube?
Create the view Model_Detail as shown on the screenshot below (2003, Actual, Year, World). In the rows the N-elements from model should be displayed alphabetically. In the columns all elements from account1 should be displayed. The formatting of the values can be adjusted in the Options.

Analyze the model by using the filter function. Position the cursor in the cell that column you want to analyze and click the right mouse key. Select Filter in the context menu.
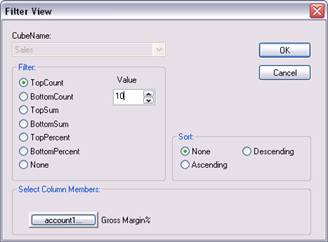
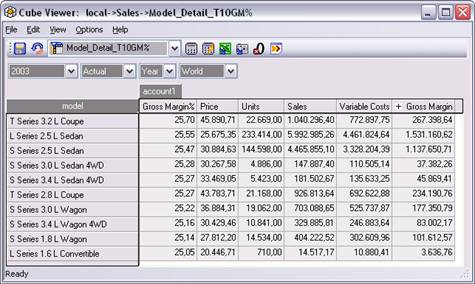
Select the 10 models with the highest margin. Save the result as Model_Detail_T10GM%.
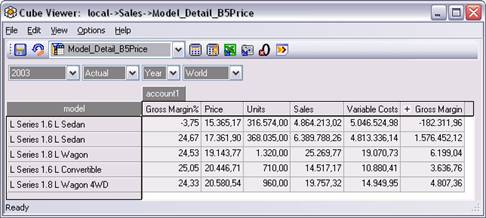
Select the five models with the lowest prices. Save the result as Model_Detail_B5Price.
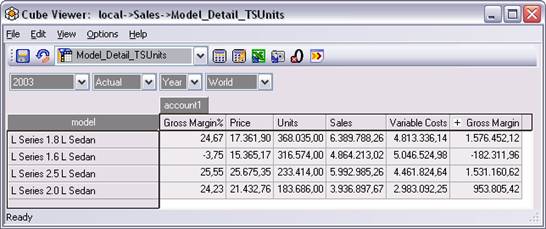
Filter from the best sold models, those that you need for selling 950.000 units. Save the result as Model_Detail_TSUnits
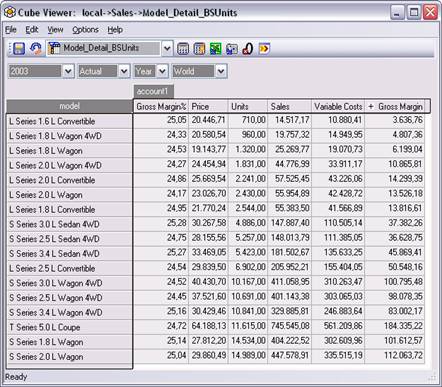
Filter from the worst sold models, those that you need to sell at least 100.000 units. Save the result as Model_Detail_BSUnits.
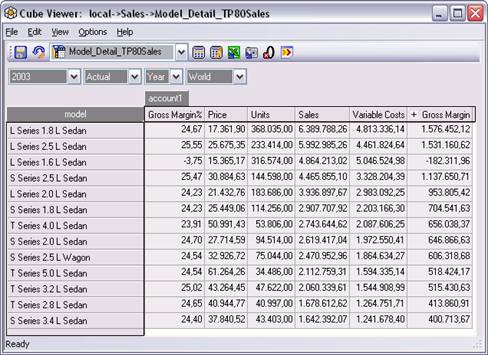
Filter the models wherewith you make 80% of your sales. Save your result as Model_Detail_TP80Sales.
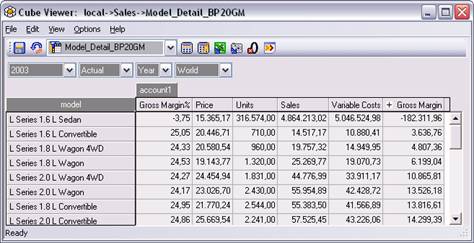
Filter the models wherewith you make only 20% of your gross profit on sales. Save this view as Model_Detail_BP20GM.
The order of the dimensions in a cube has an influence on the processor load of the RAM. The order is important for access to the data cells. That is why we can optimize the memory usage by replacing the original dimension order by an optimized dimension order. The order of the dimensions is defined for the storage of the cube in the RAM of the processor and doesn't change the structure of the cube. Go to the Sales cube in the TM1 Server Explorer and click on Cube Re-order dimensions
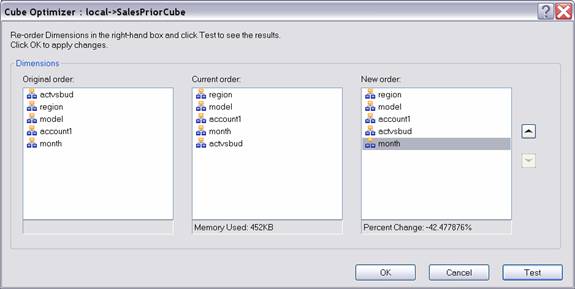
Applix generally recommends that you order the dimensions as follows: smallest sparse to largest sparse, followed by smallest dense to largest dense. In the last window you can select dimensions and move them, by pressing the arrow up or down. A new report can be created immediately to show the effects on the memory usage by pressing Test. An optimization can be achieved by reordering the dimension month to the end of the list.
More about the dimension order can be found in Help→Optimizing the dimension order
What is the difference between this cube and P&L3D?
It has five dimensions instead of three: Year, actvsbud, region, P&L and month
How can you determine whether the cube contains values or not?
Create the view Total according to following screenshot:
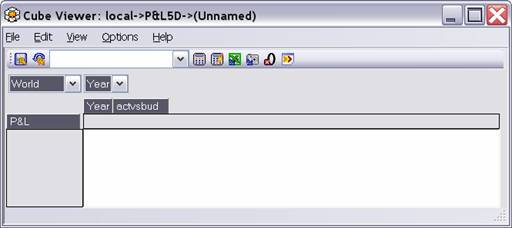
All positions of P&L (P&L)
All years (Year)
All three variants (actvsbud)
Hint: In the view above it is not recognizable which dimension is Year and which one is Month. During the creating process of dimensions such error sources should be considered and avoided.
No new dimensions have been added since Module 2. The two new cubes were created with the existing dimensions.
The values from the Sales Cube result from the SalesCube. The Turbo Integrator is illustrated by means of a process.
Execute the process cub_sales_zero_out by selecting the process in the Server Explorer and clicking on the right mouse key. Afterwards open the view Actual_Total in the Sales cube. What do you discover?
Multiple processes can be combined to a chore. Chores can be started time controlled, by other programs or by users. Execute with the right mouse key the chore Sales_New. Afterwards open the view Actual_Total for the Sales cube. What do you observe?
Open the view Actual_Total from the Sales cube. To trace the calculation for Price 2004 click the right mouse key in the cell Price 2004 and select Trace calculation. in the context menu.
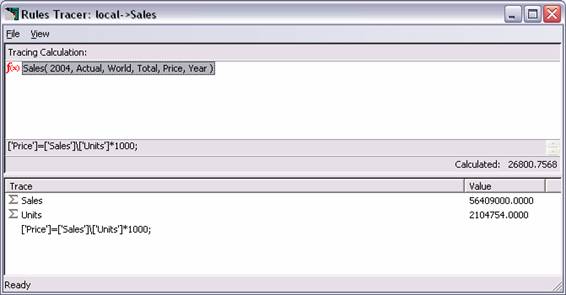
You have the possibility to select a position in the lower window and the Rules Tracer displays the origin of the values.
The window for tracing calculations offers a simple support to get an overview how consolidations work.
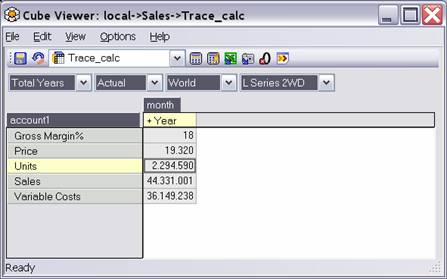
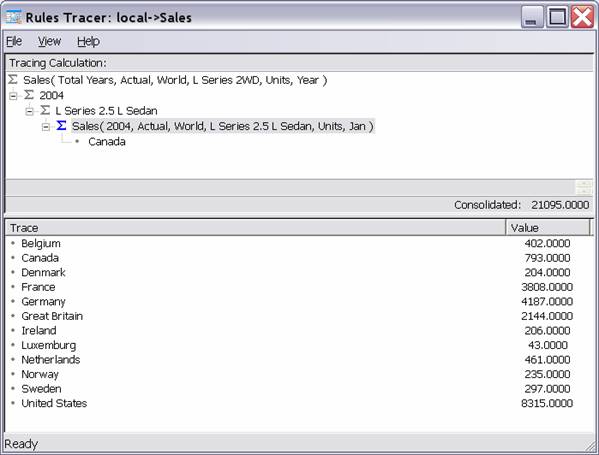
Tracing the calculation in the Sales Cube (View: Trace_calc) shows how the value units is composed. The Tracing Tool offers you the possibility to show all pyramiding down to level 0:
Also with Excel a larger amount of data can be imported. Therefore we will create a corresponding import sheet.
We create the import sheet Import_P&L5D:
Select in Excel the TM1 Menu and Process Data Example Cube. Then choose the Sales cube. The following window appears:
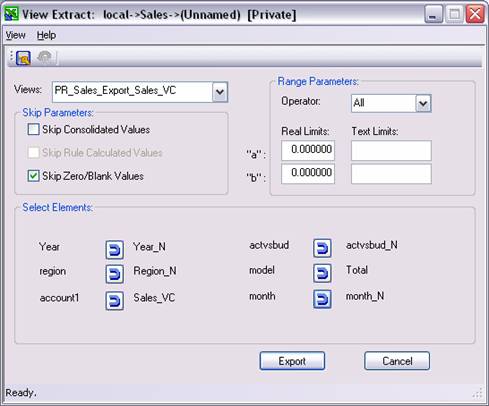
Select the elements and afterwards click on Export. The example values are imported in the first row of the Excel sheet.
Following preparations have to be done:
Therefore we can use the TM1 formula editor (TM1 Edit formula
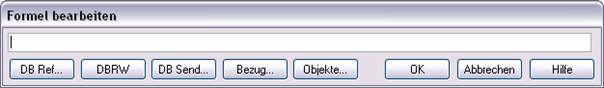
Create the following formula in H4:
=IF(H3="Send";DBS($H$2;$A$4;$B$1;$C$1;$D$1;$E$4;$G$1); H3)
If you know the detailed specifications, you can insert the formula directly by choosing Insert Function TM1 DBS or you can write it by hand.
Double-click H3 and choose Send, then select Process Data Process Cube from the TM1 menu. Select the view PR_Export_Sales_VC once more from the cube Sales.
This function retrieves a value from a specified TM1 cube.
When all element arguments (e1, e2, etc.) to the function are leaf elements, the DBR function can also be used to write values to the specified cube, provided that the user has appropriate access privileges to the relevant cube, dimensions, elements, and/or cells. When you enter a value in a cell containing such a DBR function, the value is sent to the TM1 server.
Syntax: DBR(cube, e1, e2, [.en])
cube The name of the cube wherefrom the value is retrieved.
e1,.en Dimension element names: defining the intersection of the cube containing the required value.
Arguments e1 through en are sequence-sensitive. e1 must be an element from the first dimension of the cube, e2 must be an element from the second dimension, and so on. These arguments can also be the names of aliases for dimension elements.
This function retrieves the value of a specified element attribute. The value returned can be either a string or numeric value, depending on the attribute type.
The DBRA function can also be used to write element attribute values to the TM1 server. When you enter a value, either string or numeric, in a cell containing a DBRA function, the corresponding element attribute is updated on the server.
Syntax: DBRA (dimension, element, attribute)
dimension A valid dimension name. The dimension name must be prefixed with the appropriate TM1 server name and a colon, for example, "SData:Region" references the Region dimension on the SData server.
element An element of the dimension.
attribute The attribute for which you want to retrieve a value. This argument must be a valid attribute of the element.
This function retrieves a value from a specified TM1 cube. When all element arguments (e1, e2, etc.) to the function are leaf elements, the DBRW function can also be used to write values to the specified cube, provided that the user has appropriate access privileges to the relevant cube, dimensions, elements, and/or cells. This function works the same as the DBR function, with one major difference; DBRW reduces network traffic and may improve performance on wide area networks.
In worksheets with a large number of TM1 functions, DBRW forces TM1 to execute functions in "bundles" rather than individually.
Syntax: DBRW(cube, e1, e2, [.en])
cube The name of the database cube where to retrieve the value from.
e1,.en Dimension element names defining the intersection of the cube containing the value to be retrieved.
Arguments e1 through en are sequence-sensitive. e1 must be an element from the first dimension of the cube; e2 must be an element from the second dimension, and so on. These arguments can also be the names of aliases for dimension elements.
Numeric element names must be enclosed in quotation marks.
DBS sends a numeric value to a TM1 cube. This function cannot send a string to a cube. To send strings, use the DBSS function.
When you build a DBS function with the TM1 Edit Formula option, the Edit Formula dialog box prompts you through a series of steps to build each function argument in the correct sequence.
If the cube does not exist or one of the arguments is invalid, the function returns KEY ERROR.
Syntax: DBS(value, cube, e1, e2, [.en])
value: The value being sent.
cube: The cube to which the value is sent.
e1, ..en The names of elements defining the intersection in the cube to which the value is sent.
Arguments e1 through en are sequence-sensitive. e1 must be an element from the first dimension of the cube, e2 must be an element from the second dimension of the cube, and so on. These arguments can also be the names of aliases for dimension elements.
Numeric element names must be enclosed in quotation marks.
This function sends a value to a specified element attribute. The value sent can be either a string or numeric value, depending on the attribute type.
Syntax: DBSA(att_value, dimension, element, Att_name)
att_value: The value you want to send.
dimension: A valid dimension name. The dimension name must be prefixed with the appropriate TM1 server name and a colon, for example, "SData:Region" references the Region dimension on the SData server.
If the dimension is not prefixed with a server name, the DBSA function will attempt to run against the local server.
element: An element of the dimension.
att_name: The attribute to which you want to send a value. att_name must be a valid attribute of the element specified by elem_name.
DBSW sends a numeric value to a TM1 cube. This function cannot send a string to a cube. To send strings, use the DBSS function.
This function works the same as the DBS function, with one major difference; DBSW reduces network traffic and may improve performance on wide area networks.
In worksheets with a large number of cube references, DBSW forces TM1 to send values in bundles rather than individually. Normal DBS functions are updated individually during a recalculation. DBSW references force TM1 to send all changed values within a worksheet in a single bundle.
Syntax: DBSW (value, cube, e1,e2, [.en])
value: The value being sent.
cube: The cube to which the value is sent.
e1, ..en The names of elements defining the intersection in the cube to which the value is sent.
Arguments e1 through en are sequence sensitive. e1 must be an element from the first dimension of the cube, e2 must be an element from the second dimension of the cube, and so on. These arguments can also be the names of aliases for dimension elements.
Numeric element names must be enclosed in quotation marks.
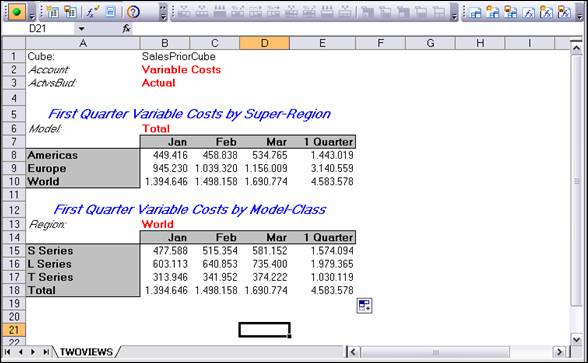
Open the Excel file Twoviews.xls in the data directory /xls. Complete the missing DBR formulas. You two possibilities:
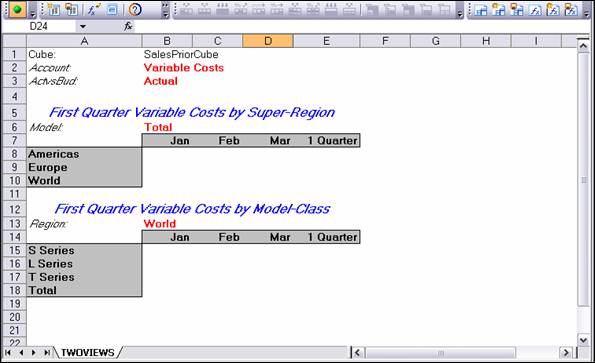
Insert the formulas in the upper table by hand by hand and in the lower table by using the formula editor. Do not forget about the relations - whether the formula should refer to the column, to the row or a certain cell - when inserting the formulas.
If you have entered all formulas, you should get the following result:
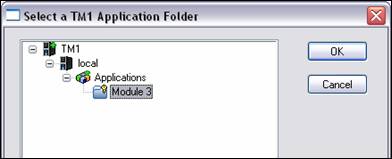
Save the spreadsheet into the TM1-applications. Therefore choose in the TM1 menu: TM1 → save workbook on TM1 server→ upload new application file on TM1 Server
Select Module 3.
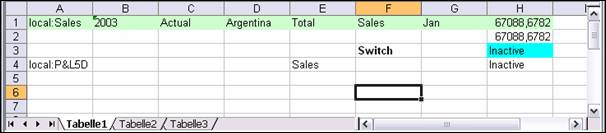
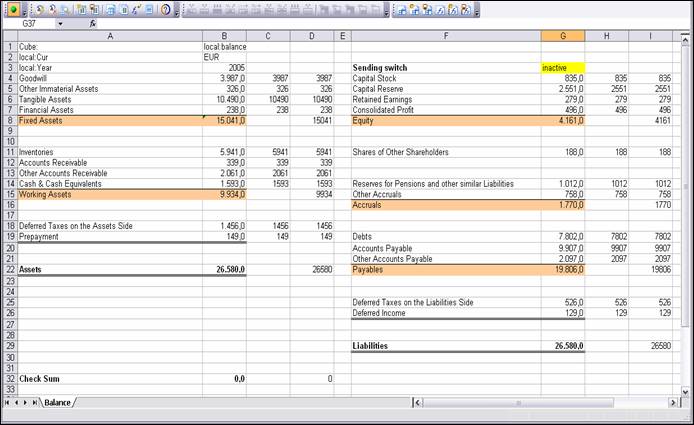
Open the file balance.xls. from the data directory \xls.
Fill the cube balance with these values. The cube consists of the dimensions Cur, Balance and Year. The currency in this sheet is EUR and the year is .

Before sending the data all references should be defined in the worksheet. Therefore you have to write into cell A1 CUBE: and into cell B1 local:Balance. Then you should define the elements of the dimensions. So you have to type local:Cur into cell A2, EUR into B2, local:Year into cell A3 and into B3.
A sending switch should be inserted. Herewith you can decide when the values are to be sent into the database.
Now you can insert the suitable DBS formulas in column C and H. For checking the sent values, write DBRW formulas into columns D and I.
After inserting all formula accordingly and activating the send-switch, the values can be sent. By pressing F9 twice the values are sent into the database and your sheet should look like the following image. Note: Before saving the sheet set the send-status back to Inactive.
Save the Excel-sheet in the applications in module .
Now you can check the data in the target cube balance:
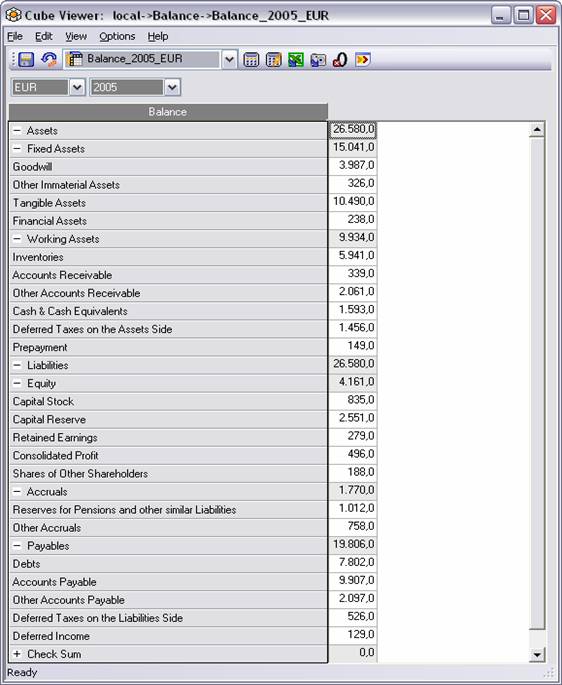
Save this view as Balance_2005_EUR.
We want to create one more attribute for the dimension month_c. The attribute entries should be sent via Excel.
Therefore you have to open the Attributes Editor for the dimension month_c. Choose Edit → Add new Attribute. The name of the new attribute is Monat and is saved as an alias. TM1 sets initial values for all elements of an alias attribute.
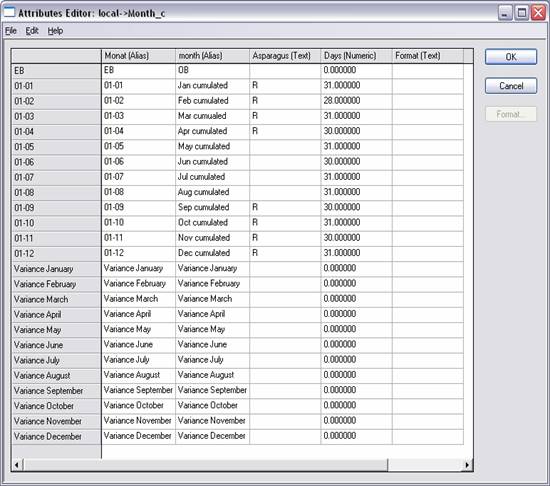
Confirm with OK and go back to Excel.
Open the file month_attribute.xls in the list \xls.
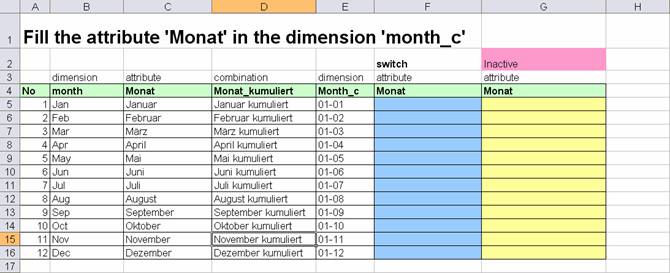
With this file the attributes from the dimension month are read out.
corresponding index written in column A.
Column B
the corresponding index written in column A + 1.
month_c
At the beginning you should have in Column F the same values as in Column D. Make a double click on the sending switch and select send. Then press F9 for recalculating.
If you press Recalculate the first time, the values are sent to the data base. After pressing it a second time, the values from the data base should be written into Column F. After successful realization your Excel-sheet should look like this:
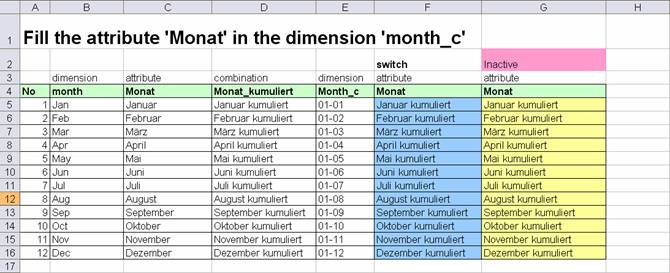
Save month_attribute.xls as an application in Module 3.
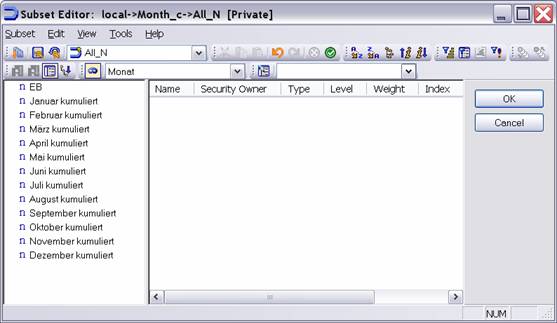
Open the Subset Editor for the dimension month_c. Select all N elements, choose the alias Monat and save the Subset as All_N.
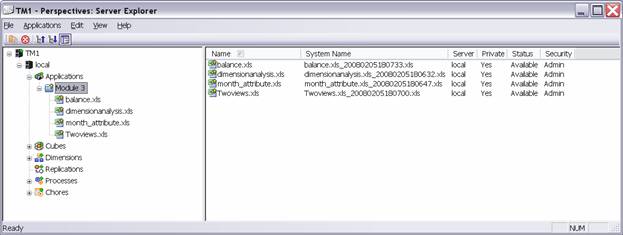
After successful realization of the preceding tasks your applications should contain 4 Excel-sheets.
First an ODBC connection must be established:
Settings administrative tools data connections (ODBC) system-DNS
Modify the data base sales in the list \MDB.
With this function you have access from the lowest level of a cube to detailed information in another cube or a relational data base.

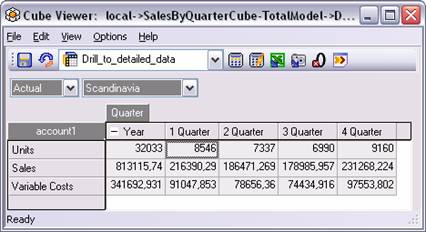
Open the view Drill (SalesByQuarter Cube-TotalModel), click on 1 Quarter / Units with the right mouse key and select Drill.
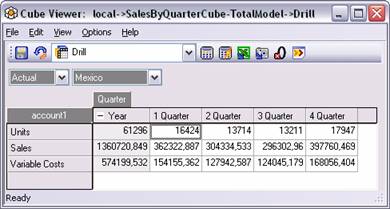
Then TM1 open this window. Try both possibilities.

Open the drill_to_detailed_data view and select Drill in the different cells.
This function shows us elements from the level directly above (parents). Select one more time the view Drill in the SalesByQuarterCube-TotalModel and open the Subset Editor for account1. Select the following elements: Variable Costs und Sales
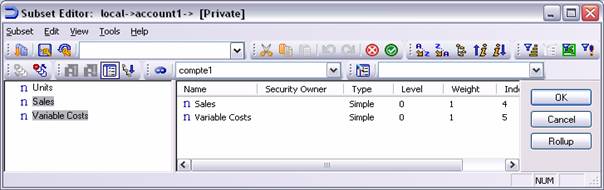
Afterwards press Edit→RollUp or click on the Rollup button. You have also the possibility to click on this icon: ![]()
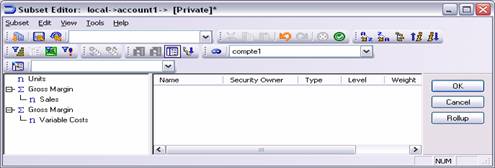
For each selected element TM1 shows us the parent element.
You can use the Rollup button on the Subset Editor to quickly create a subset containing only a user-defined consolidation. This process is easier to execute than inserting a user-defined consolidation into an existing subset, but yields a subset that cannot be saved or edited. This process is available only when you open the Subset Editor from a cube view (Cube Viewer or In-Spreadsheet Browser) and is best suited for quickly creating a consolidation of elements while browsing a cube.
To create a user-defined consolidation with the Rollup button:
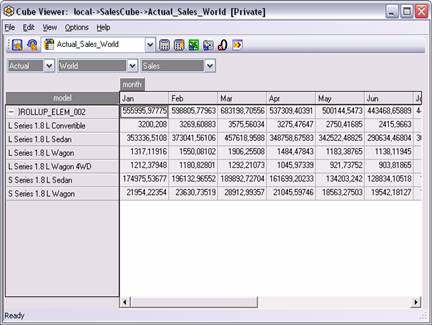
Open the view Actual_Sales_World from the SalesCube.
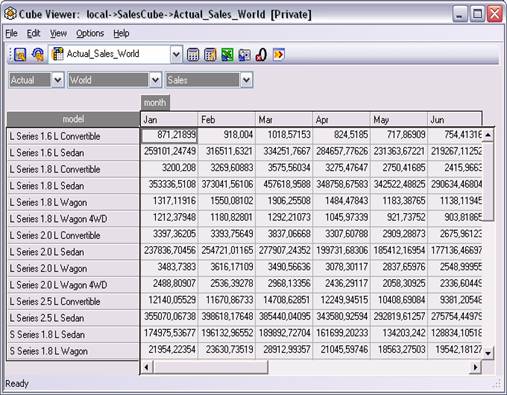
Open the Subset Editor for the dimension model.
Select every model that has 1.8L. Then click Rollup.
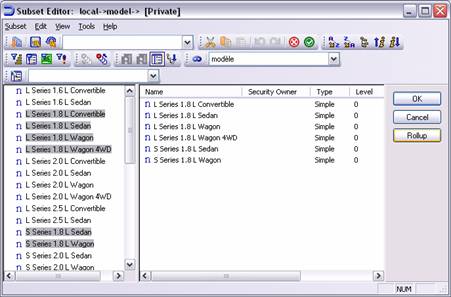
The Subset Editor closes and the user-defined consolidation appears in the cube view with the name }ROLLUP_ELEM_###, where ### is a zero-based sequential number.
This user-defined consolidation is considered a "pseudoelement" of the subset. You can apply all sorting methods against the user defined consolidation, and can select the user-defined consolidation using the Select by Regular Expression option in the Subset Editor. However, the user defined consolidation is not assigned a unique level in the subset; you cannot use the Select by Level option in the Subset Editor to select the user-defined consolidation.
You get the following on your display:
Note that if you save this view, the user-defined consolidation is not saved as part of the view, though the members of the consolidation are.
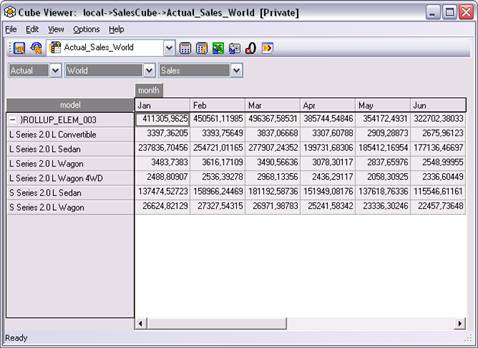
Open one more time the view Actual_Sales_World from the SalesCube. Repeat the selection from above but with 2.0. L. You should have the following on your display:
ODBC Access to relational data
We have already installed the ODBC connection Sales. So we have direct access from TM1 to the Tour table, which is an MSAccess table. We can use this access to create cubes and dimensions and afterwards to import data.
In the following the process dim_pictures is created. Open the context menu on Processes and select Create new process. Then the following window appears:
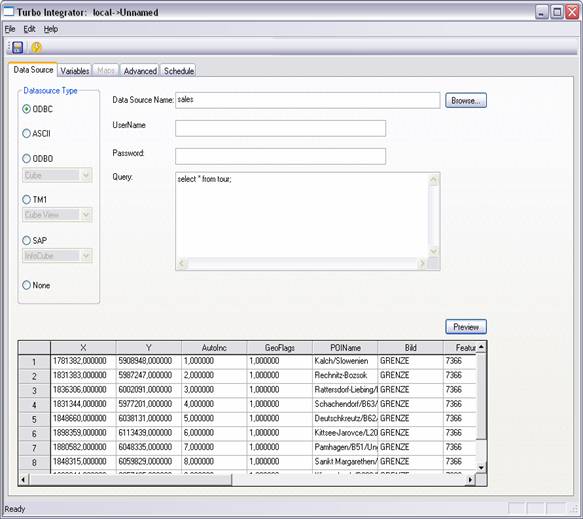
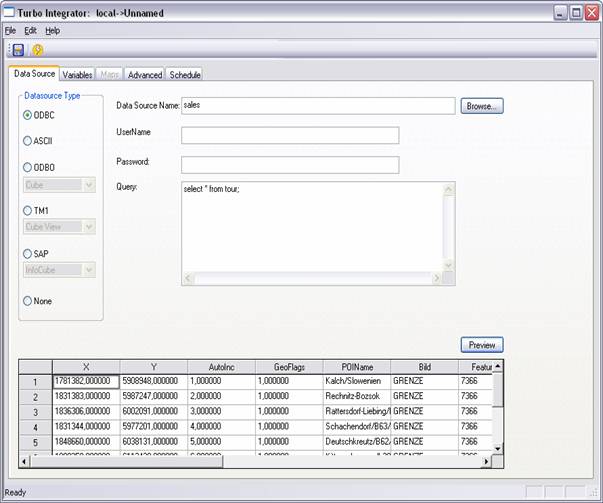
Choose the data source type ODBC and click for the name of the data source on Browse. Select the mdb. file sales from the data directory /MDB.
Write the query 'select * from tour' into the designated field. This query gives us all the data from the table Tour. Click on Preview and you can see a preview of the values from the table.
Open the tab Variables:
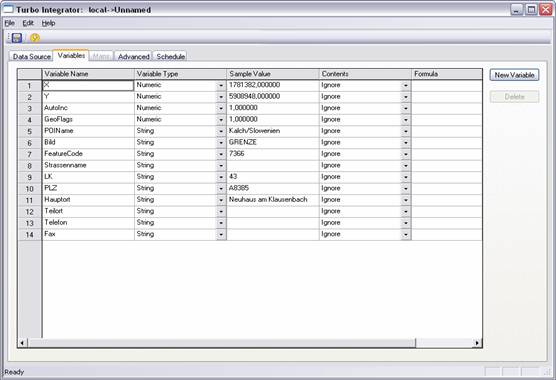
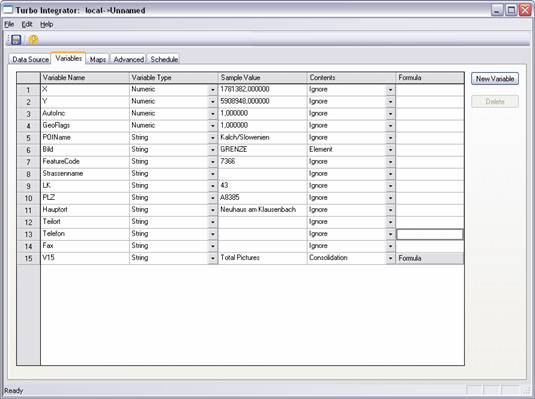
Select 'Element' for the variable Bild. Create a New Variable by clicking the button. A fifteenth variable with the name V15 appears. Define the Variable Type as String and for Contents select Consolidation.
Click on formula, the following window opens. Enter the following:

Confirm with OK.
Click on the tab Maps.

Open the tab Dimensions. TM1 selects automatically Bild as Element Variable, because this was the only variable stated as an element. The dimension's name is Pictures.
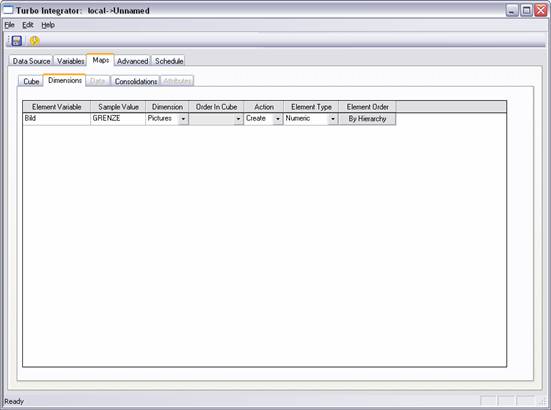
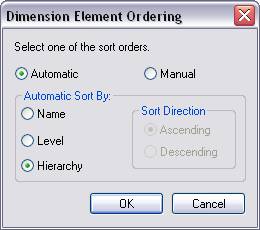
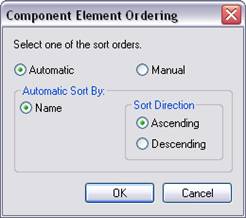
Click on Element Order and in the following window select Automatic and Hierarchy.
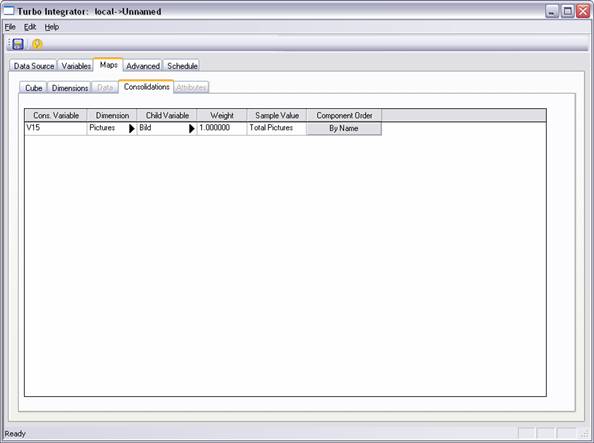
Here everything is appointed automatically, except for the component order. Here you select the following:
If you have done all settings, click on the following icon:
![]() Execute
Process
Execute
Process
TM1 opens the following window:
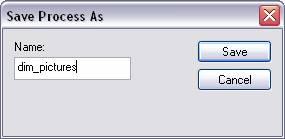
Save the process as dim_pictures.
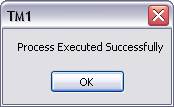
After the process is executed this announcement appears on the screen.
Open the dimension Pictures.
As you can see, Total Pictures is the consolidation and all pictures are its subordinated elements.
Therefore we will create a new process. Again click with the right mouse key on Processes and select in the context menu Create new process.
We select the Sales data base once again and write the query Select * from tour.
Click on preview and the table should appear:
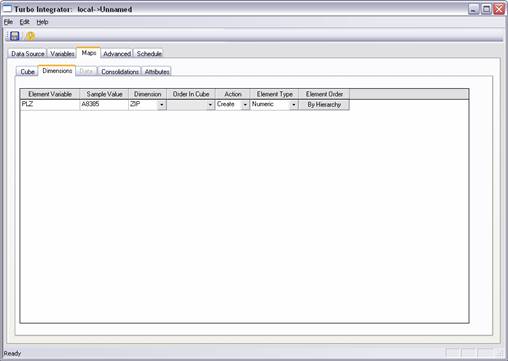
Define LK (Country Code) as a Consolidation, PLZ (ZIP) as an element and Hauptort as Other.
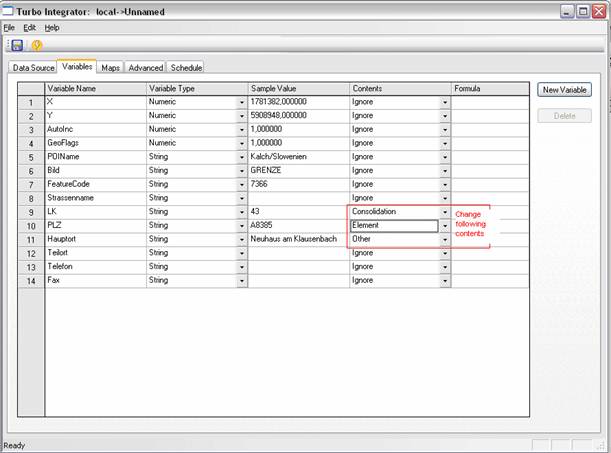
Afterwards you create two new variables:
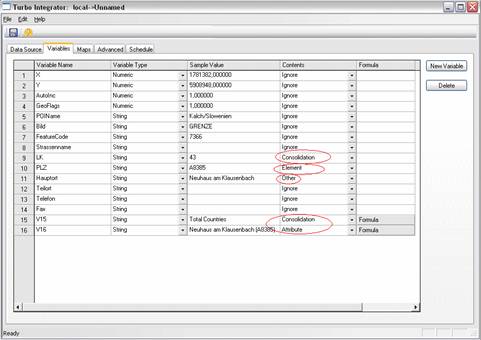
Both variables are Strings. The first one defined as Consolidation and the second as Attribute.
The formula for the first variable is:

The formula for the second variable is as follows:
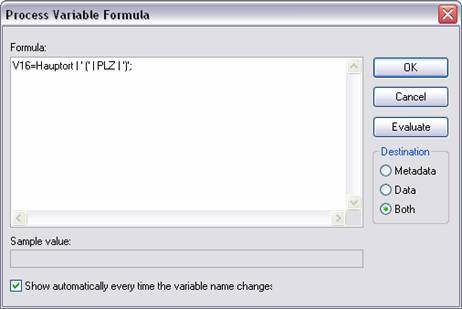
The | signs signifies connect with. Notice that the semicolon is not to be forgotten at the end of the formula.
Regarding the cube, you select no action.
Regarding the dimensions you choose ZIP. Select the action Create and Element Type Numeric.
Regarding the Dimension Element Ordering you should select the following:
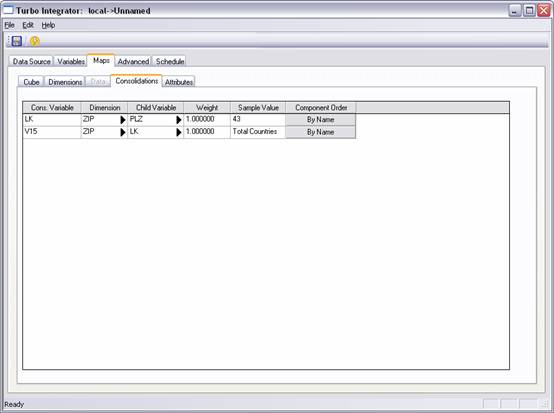
Select PLZ as a Child Variable of LK and LK as Child Variable of V15. For the Component Order you have to select for both variables Automatic→Name→Ascending.
PLZ has to be selected as Element Variable.
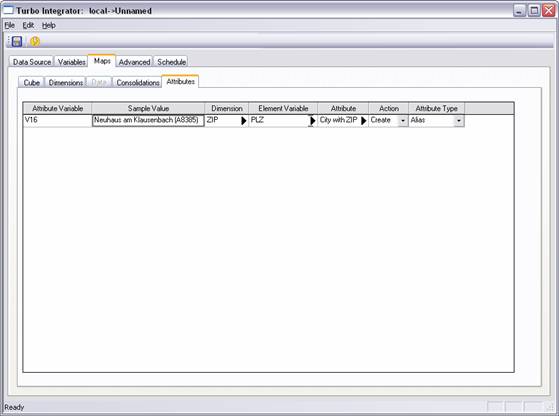
The name of the attribute should be City with ZIP. The attribute's type is Alias.
Now the setup for the process is finished.
Click again on the Icon execute.
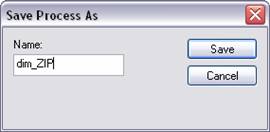
Enter the name dim_ZIP and confirm with Save. Afterwards the process is executed.
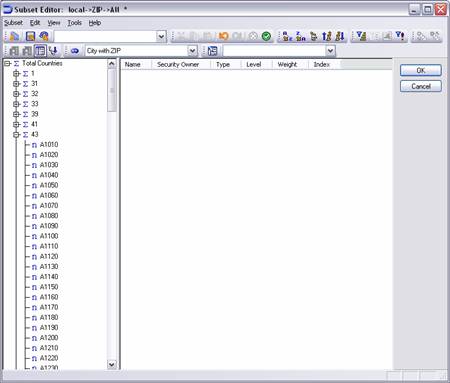
The dimension PLZ is created. Open the Subset Editor for ZIP and you should see the following:
We need to define another process for creating the cube tour Therefore you have to click again on Processes Create new process. The data source remains the same as for previous processes.
The variables X and Y are defined as data. Bild and PLZ are defined as elements.
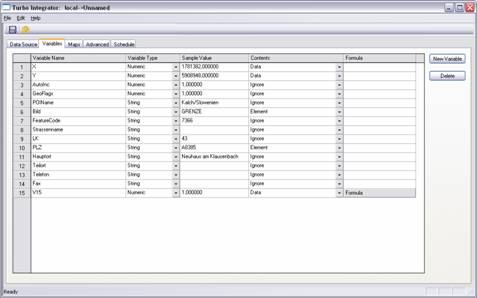
Create a new variable. This time it is numeric. At contents you select data and for the formula you enter the following:

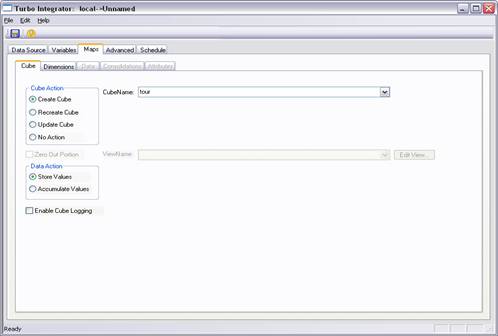
Select Create Cube; the Cube Name is tour.
Select Pictures for the first dimension and ZIP for the second. The third dimension is called Tour Values and it should be created while running this process.

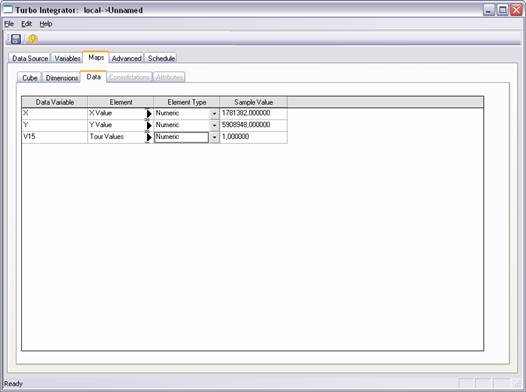
Enter the values as seen in the screenshot.
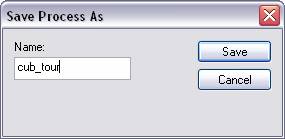
This time we save the process as cub_tour.
yippie!
Create the following view in the cube tour.
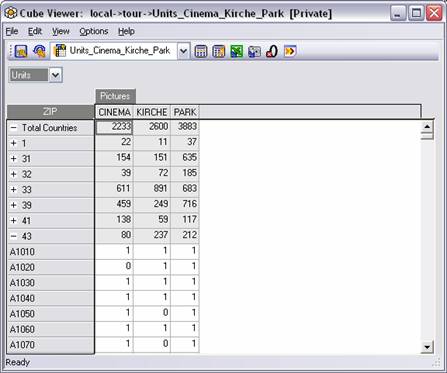
Save this view as Units-Cinema-Kirche-Park. As you can see here only 1s are standing in this cube for the element Units. This results from the fact that TM1 has overwritten the values every time. To prevent this, we open the process cub_tour once again. Select Maps→Cube.
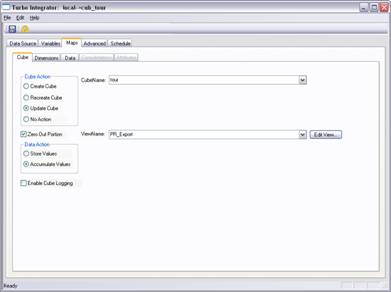
Click Update Cube, Zero Out Portion and Accumulate Values.
Create a new view like this:
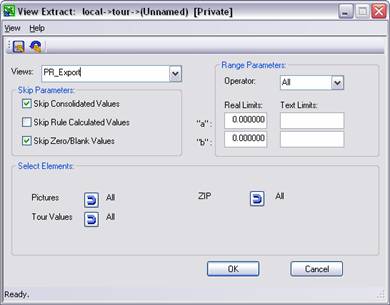
Name it PR_Export. When running the process again, the area - defined in this view - will be deleted and afterwards the data will be imported. Execute the process one more time.
 After running the process successfully, the
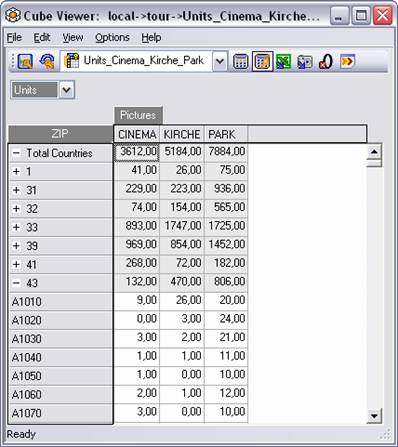
view Units_Cinema_Kirche_Park
should have these data entries.
After running the process successfully, the
view Units_Cinema_Kirche_Park
should have these data entries.
|
