We use the model Linearize.em and adapt it to generate pulse signals.
The description of a dirac
pulse in the
For the first experiment, we use only one of the pulses:
Start time = 0, stop time = 0.001, amplitude = 1000, step size integration = 0.001
The resulting FFT is:
We can compare this with the real transfer function by linearizing from the force to the velocity of mass 2:
We can write the gain and phase response of the FFT algorithm by selecting from the menu: Properties - Data File. If we import this information in the bode-plot, the result is (dark blue line is FFT).
The high frequency noise in the FTT is generated by little timing errors. We can reduce these timing errors by resampling the data: View - Resample Curves:
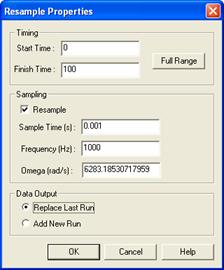
The result is:
Adding more dirac
pulses will not improve the FFT signal. This is obvious because the
Using other force signals
will change the FFT response because the
As you see, the signal does not have a unit gain and a very large phase drift at high frequencies. The resulting FFT for the system will therefore not be equal to the transfer function response anymore.
The method of integration will influence the outcome of the FFT plot. This is shown in the next plot where the system has been simulated with Euler (dark blue) and Runge Kutta 4 (light blue). The biggest influence of the integration methods on the plot is at the low frequencies of the gain plot. The more accurate the integration method (smaller stepsizes etc.) the better the resulting FFT plot.
The standard sine sweep is even worse:
|
