ALTE DOCUMENTE
|
|||||
Adding Data Through the Web
A data access page gets its data from an Access database
or from a SQL Server database. However, Microsoft Office Web Component
controls on the page can display data from other sources, like an Excel
spreadsheet or chart. Microsoft Office Web Component controls are
interactive components, such as worksheets and charts on Web pages, that facilitate data analysis. For more
information, see "About data access pages" in Access 2002 Help.

![]() Your
students do not need to use the classroom computer where the database is housed
to add data. In fact, they can easily view and add information to a database
from your school intranet, from home, or from anywhere in the world. You
accomplish this by creating a data access
page, which is a Web page 11411d36l published from Access.
Your
students do not need to use the classroom computer where the database is housed
to add data. In fact, they can easily view and add information to a database
from your school intranet, from home, or from anywhere in the world. You
accomplish this by creating a data access
page, which is a Web page 11411d36l published from Access.
When you create a data access page, add it to the database, and save the database to a network server, your students can enter data directly into the page while viewing it in Microsoft Internet Explorer 5 or later. This view is called Page view. Everything students add to the Web page is immediately saved in the database.
In addition to helping you manage records, data access pages encourage collaboration by providing an efficient way for students to contribute to a single assignment. For example, you can give a homework assignment in which students use the Web to add data to the table in the Shipwrecks database.
Designing a data access page does not require any programming knowledge. From Access 2002, you can create the page in Design view, or you can use the Page Wizard.
To create a data access page by using the Page Wizard
In the Shipwrecks database window, under Objects, click Pages.
Double-click Create data access page by using wizard.
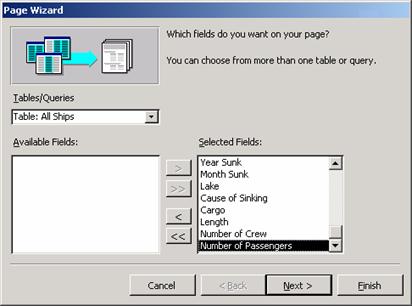
In the Tables/Queries list box, click the table or query from which you want to create the form. For example, select the All Ships table from the list.
Select the fields that you want your data access page to include. To base the data access page on the full All Ships table, select all the fields by clicking the double forward arrow. Click Next.
On this page of the wizard, you can create a hierarchy that groups records from general categories to specific details. Click Next.
Note If you wanted to set up a hierarchy, you would use the buttons next to the list of fields to add and prioritize grouping levels. For an example of what grouping levels look like, go to the topic in Access 2002 Help titled "About grouping records," and then click On a data access page.
Select a sort order for the fields. For the Shipwrecks database, a logical way to order records is alphabetically by ship name. To do this, in the first list box, click Ship Name (the Ascending button is selected by default). Click Next.
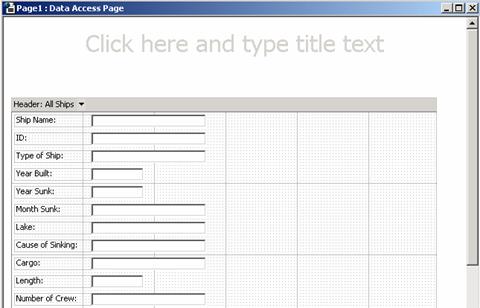
Type a title for the page, click Open the page, and then click Finish.
The database appears in Page view.
Although you create the data access page in Access 2002, it is not stored in the database. Data access pages are saved as HTML files in one of the Windows desktop folders; Access 2002 then adds a shortcut to the file in the database window.
To save a data access page
In Page view, on the File menu, click Save.
Browse to the folder where you want to store the HTML file.
Click Save.
PivotTable and PivotChart views
Access 2002 offers PivotTable and PivotChart views of tables, queries, views, stored procedures, functions, and forms. To understand the technology that these views are based on, it is helpful to know what PivotTable and PivotChart reports are.
In a spreadsheet program like Excel 2002, you can use a PivotTable report to highlight data that meets specific criteria, while hiding the remainder. PivotTable reports make this especially easy when you are analyzing large quantities of data that contain both numeric and nonnumeric data; for example, shipwreck location, year, and cause. After all the data is collected in a spreadsheet, the organization of the data can be manipulated by rearranging, or pivoting, the layout based on specified row and column headings.
Based on the shipwrecks example, an Excel 2002 user might want to further explore the data to see if more ships wrecked in a certain area because of fire or grounding. The layout can be changed at any time by adding or removing headings to find these trends or exceptions, while the original data set remains intact. The data analysis can then be graphically expressed as a PivotChart report. This type of comparative analysis is where Access can help students get beyond just reporting on information, and dig into rich analysis.
With Access 2002, you can perform data analysis and build rich PivotTable and PivotChart views more quickly than ever before. For example, you can open a query in PivotTable view or PivotChart view to analyze data. You can rearrange row headings, column headings, and filter fields until you achieve the desired layout. Each time you change the layout, the form immediately recalculates the data based on the new arrangement. PivotTable and PivotChart views can be saved as data access pages that can be viewed by anyone who has Internet Explorer 5 or later.
To create a PivotTable view
You can use the same procedure to create PivotTable views
for other objects, like tables and forms.
In the Shipwrecks database window, under Objects, click Queries, and then
double-click the query you want to open. For example, open the Shipwreck Causes
query.

On the toolbar, click the arrow next to the View button, and then click PivotTable View.
You see a blank PivotTable view without any fields or data; you now must add the fields from the PivotTable Field List dialog box, which appeared on the right side of your screen.
Note You
can open and close this dialog box by clicking the Field List button ![]() on the toolbar.
on the toolbar.
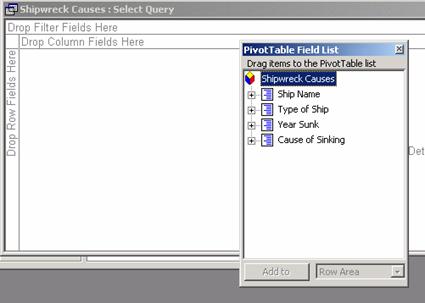
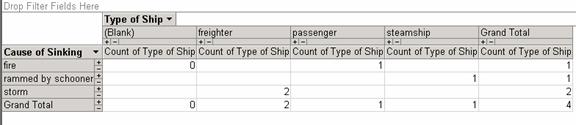
In the PivotTable Field List dialog box, drag each field to the place where you want it to appear in the PivotTable view. For example, if you want to compare types of ships and causes of sinking, drag the Type of Ship field to the area for column fields, and drag the Cause of Sinking field to the area for row fields.
Note The next procedure is for creating a PivotChart view from the same query.
To create a PivotChart view
On the toolbar, click the arrow next to the View button, and then click PivotChart View. You see a PivotChart view with some of the fields and data added from the PivotTable view that you created.
Drag Count of Type of Ship to the area for data fields.
To customize the appearance of the PivotChart view, on the toolbar, click PivotChart. For example, click PivotChart, and then click Show Legend. Your PivotChart view is now a bar chart that compares types of ships with causes of sinking.

To save the object with the new PivotTable and PivotChart views, on the toolbar, click Save.
|
