ALTE DOCUMENTE
|
||||||||
Start EXCEL and enter some numbers in cells A1 to A10. In cell A12, type "=AVERAGE(A1:A10)" (without the quotes!). You will see the average of the 10 numbers you used appear in cell A12. You can do this in code. First, you will need to manually add a code module to your workbook by selecting "Insert", "Module" within the VBA editor. Type:
Sub AverageCells()
Range("A12").Formula = "=average(a1:a10)"
End Sub
|
|
Now move back to your worksheet, probably Sheet1. If the "Forms" toolbar is not visible, right-click on the menu and select it. You will see a group of controls like this:
|
|
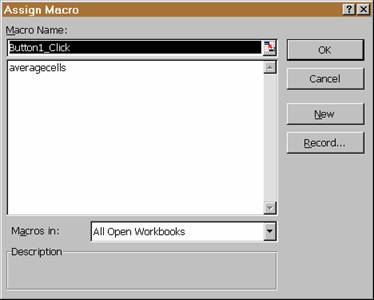
Click on the 4th from the left (the button icon) and draw a button on the worksheet in some convenient place (NB if you hold down the ALT key while you draw the button it will automatically size itself to the cells). As soon as you release the left mouse button, a dialog box will appear:
Running the macro will insert the average of the cells A1 to A10 into A12.
This macro operated by simply placing a formula into a required cell. In order to begin to see how EXCEL VBA works let's look at two other ways of doing this, one by utilising the in-built AVERAGE function to return a value directly, and another by calculating the average in code.
Sub AverageCells2()
av = Application.Average(Range("a1:a10"))
std = Application.StDevP(Range("a1:a10"))
msg1$ = "The average of rows 1 to 10 in Column A is " + Format$(av, "##.0000")
msg2$ = "The standard deviation of these values is " + Format$(std, "##.0000")
MsgBox msg1$ + Chr$(10) + msg2$
End Sub
This code will retrieve the values of the average and standard deviation of the data in cells A1 - A10 and print it out in a message box. You can refine this as follows to allow for any number of data points to be entered:
Sub AverageCells3()
Dim r As Range
Set r = Range("A1").CurrentRegion
n = r.Rows.Count
av = Application.Average(r)
std = Application.StDevP(r)
msg1$ = "The average of rows 1 to " + Format$(n) + " in Column A is " + _
Format$(av, "##.0000")
msg2$ = "The standard deviation of these values is " + Format$(std, "##.0000")
MsgBox msg1$ + Chr$(10) + msg2$, 64, "Stats"
End Sub
Note that the range object has a property called "CurrentRegion" which you can use to retrieve the entire "Used" region of which cell "A1" is a part. We set the value of r (dimensioned as a Range object) to this region and use the Rows.Count property of this object to recover the number of rows in the region. The rest is as before.
Alternatively we could do this:
Sub AverageCells4()
thisrow = 1
thiscol = 1
n = 0
s = 0#
s2 = 0#
While Cells(thisrow, thiscol) <> ""
x = Cells(thisrow, thiscol)
s = s + x
s2 = s2 + x * x
n = n + 1
thisrow = thisrow + 1
Wend
av = s / n
std = Sqr((s2 / n - av * av))
msg1$ = "The average of rows 1 to " + Format$(n) + " in Column A is " + _
Format$(av, "##.0000")
msg2$ = "The standard deviation of these values is " + Format$(std, _
"##.0000")
MsgBox msg1$ + Chr$(10) + msg2$, 64, "Stats"
End Sub
This code loops through the rows, accumulating the values of the numbers and their squares, until it finds a cell in column 1 that is empty. It then exits the loop, calculates the mean and standard deviation and prints out the result.
Modify this code to insert the mean and standard deviation in cells B1 and B2 respectively, instead of displaying a message box with this information.
To extend the capabilities of the macro described above, we would like to supply EXCEL with some data on disk that would be read in and statistically analysed. To begin with we'll stick to some simple statistics - the mean and standard deviation again.
The data on disk (file Tut1.dat) look like this:
This is some test data for Task 2.2
"x-values","y-values"
First, write a short piece of code to clear plenty of space in columns A and B of the worksheet, and then to read in these data and display them in the worksheet:
Dim xvals(100) As Single
Dim yvals(100) As Single
Dim npts As Integer
Sub GetDataFromDisk()
Range("A1:B100").Clear
Range("A1").Font.Bold = True
Open "C:\Excel Files\tut2a.dat" For Input As #1
Line Input #1, Title$
Cells(1, 1) = Title$
Input #1, xtit$, ytit$
Cells(2, 1) = xtit$
Cells(2, 2) = ytit$
npts = 0
While Not EOF(1)
npts = npts + 1
Input #1, xvals(npts), yvals(npts)
Cells(2 + npts, 1) = xvals(npts)
Cells(2 + npts, 2) = yvals(npts)
Wend
Close #1
End Sub
The first 3 lines of this code define arrays which will contain the data, and reserve some memory for them. Single defines the variable array to consist of short floating-point numbers. The meaning of the two range statements should be self-evident. The "Open" line opens the disk file specified by the path (modify this for your case as necessary) in the input mode and assigns it a channel number of 1. The next line reads a complete line of text from channel 1 into the variable Title$. This is then placed in the top-left corner cell of the worksheet, cells(1,1).
The next line reads in the title of each of the two columns. Note that we have not used Line Input here, because we want to read the two values into separate variables xtit$ and ytit$. These values are placed into cells (2,1) and (2,2) respectively.
The last block of code then reds in the rest of the numbers, which it expects to find 2 to a row. The variable npts is used to keep a count of the number of points read in. The look ends when the end of file on channel 1 is reached and the disk file is then closed.
Modify this code (altering the path to the data file as necessary) to add:
the number of data points
the arithmetic mean of the y-values
the standard deviation of the y-values
the maximum and minimum values and
the range
together with suitable labels in some appropriate place in the worksheet.
Excel provides a wide range of date-handling features. We will look at these, and make use of them, in developing a macro to produce a year calendar. The idea is to prompt the user to enter the year, and the macro will produce the calendar.
Relevant functions (which you might want to look up in the help file) are:
NOW, DATE, DATESERIAL, DATEVALUE, MONTH, DAY, YEAR, WEEKDAY
The first step is to format your worksheet so that it forms a suitable template. This means designing the rows and columns to contain the months and days in such a way that it fits conveniently on a landscape sheet of A4. The following are some sample figures that seem to work, but feel free to experiment for yourself!
Set the width of column A to 9.89, and columns B-AL to 2.67.
Set the height of row 3 to 31.8, row 6 to 25.1 and rows 7-18 to 30.
Put the month names January, February, . in rows 7-18, column 1, font size 10.
Put day names Mo, Tu, We, Th etc in cells B6-AL6, aligned centrally, font size 8.
Select cells A3-AL3, make them bold, font size 26, and click the "center across selection" icon:
![]()
Remove the gridlines, and go into "File" "Page Setup" and choose "Landscape" for the page format.
Put borders around the figure to define the cells of the calendar.
Now invoke the VBA editor, add a new module, and enter this code:
|
Sub docal() Dim wkday$(7) wkday$(1) = "Sunday" wkday$(2) = "Monday" wkday$(3) = "Tuesday" wkday$(4) = "Wednesday" wkday$(5) = "Thursday" wkday$(6) = "Friday" wkday$(7) = "Saturday" yr = Application.InputBox("Year for calendar (e.g. 1997)", "Enter Year") If yr <> False Then Range("B7:AL18").ClearContents Cells(3, 1) = yr For zmon = 1 To 12 zday = 1 n = DateSerial(yr, zmon, zday) 'MsgBox wkday$(WeekDay(n)) colstart = WeekDay(n) If colstart = 1 Then colstart = 8 While Month(n) = zmon Cells(6 + zmon, colstart - 1 + zday) = zday zday = zday + 1 n = DateSerial(yr, zmon, zday) Wend Next zmon End If End Sub |
Run the program, and see if you can figure out how it works!
What is the function of the colstart variable?
What is the function of the zday variable?
What does DateSerial do?
How does it know where to put the day number?
What are the problems with this code?
How can you handle the entry of incorrect data by the user?
Have a look at a finished version.
This short exercise will serve to demonstrate how you can supplement the set of built-in functions available to you in your worksheet with some home grown ones. Of course, it goes without saying that if Excel has a built-in function that will do what is required, you should use that - it will be more highly optimised than anything you can write in VBA!
Supposing we wish to create a function which carries out a specific calculation which is going to be used frequently in our worksheet, and which is clumsy to enter in the worksheet cell explicitly.
Enter the following code into a macro module:
Function Robert(x,y,z)
Robert=x+y+z
End Function
You will now be able to access this function from your worksheet in the usual way:
=Robert(4,5,6)
or
=Robert(A1,A2,A3)
Look also at the exercise in the notes, regarding the factorial function.
Exercise
Try writing a function which locates the largest number on a specified worksheet and reports its value together with its row and column. The function call should be: =FindLargest(n), where n is the number of the worksheet to search. What happens if you ask for the sheet with the function call to be searched? Can you see what the problem is?
There are innumerable ways in which programming tools can be applied to a worksheet to add custom-designed functionality. In this task, we can look at one or two of these, to give an idea of what is possible and how it can be achieved.
This application maintains a list of students in a group, along with their attendance records. The user enters a backslash character (\) for each class, for each student who attended. The code should then count the number of students, how many attended, fill in the blanks with zeros, and update some totals.
The basic spreadsheet should look like this:
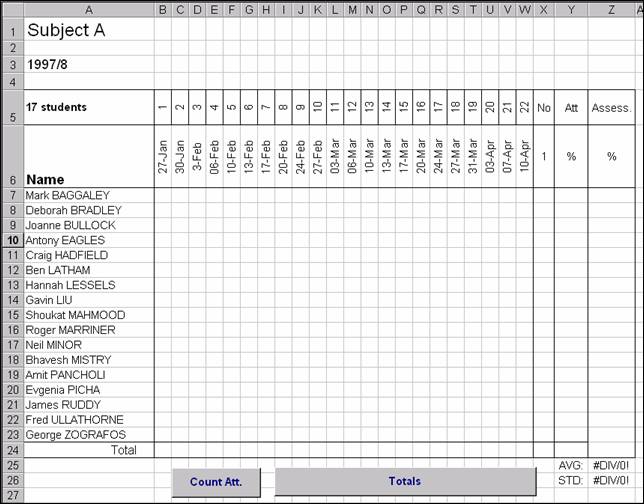
Have a think about how you would write some code to find out how many students were in the class, and place this information in cell A5 (as shown in the figure).
Next, once the user has entered the attendances for a particular session (i.e. column), you need to count the number of attendances, put this into the bottom (total) row, and insert a zero for the absences.
Finally, you need to produce a running total of the attendances for each student in the last column, and the total number of classes to date.
You might also try to ensure that students who were absent for a good reason (or started the course late) were not penalised - effectively, these classes would not count for them.
You should have a go at trying to do this yourself, but I have supplied a (suggested) solution, but try not to look at it immediately. When you do, see if you can figure out where each of the requirements listed above is met within the code.
|