ACADEMY OF ECONOMIC STUDIES
FACULTY OF BUSINESS ADMINISTRATION
(ENGLISH TEACHING)
GRADUATION THESIS
FINANCIAL RATIOS ANALYSIS
CASE STUDY: S.C. POLICOLOR S.A.
Scientific Coordinator: Graduate:
Ph. D. Dan Dumitru Popescu Lavinia Stela Andrei
July 2008
Table of Contents
Introduction ............................ 3
Company Profile........................... 4
Company History Timeline................... 4
Shareholders and Stock Market Information............. 6
Company's Products..................... 7
Figures and Trends....................... 9
Financial Ratios Methodology..................... 12
Liquidity Ratios......................... 13
2.2 Asset Management Ratios................... 15
2.3 Leverage (Gearing) Ratios................... 16
2.4 Profitability Ratios...................... 19
2.5 Financial Efficiency Ratios................... 22
2.6 Market Value Ratios....................... 23
2.7 Benchmarks for Financial Ratios Analysis............. 24
3. Analysis of Policolor's Financial Ratios................... 26
Liquidity Ratios........................ 26
3.2 Asset Management Ratios.................... 27
3.3 Leverage (Gearing) Ratios.................... 29
3.4 Profitability Ratios....................... 30
3.5 Financial Efficiency Ratios................... 32
3.6 Market Value Ratios....................... 34
Conclusion.......... ..... ...... 35
4. Action Plan............................ 38
4.1 Action Plan 1 - Cashing in Accounts Receivable........... 39
4.2 Action Plan 2 -
4.3 Action Plan 3 - Acquiring More Efficient Equipment.......... 41
Bibliography.......... ..... ...... 42
Annexes.......... ..... ...... . 43
Introduction
"How can a manager make a company grow?" This is THE question in a time when market share is where a company's energy and resources go into. This is the question I would like to be able to answer when in a management position. But in order to provide an answer, there are certain steps one needs to follow. As in most 22122p158w management processes, everything starts with the analysis of the current situation of the company. Where does the company stand? What are its strengths and weaknesses? These and many other questions can be tackled and worked out using the financial ratios analysis.
Financial ratios are a very versatile and easy to use tool that is extremely useful in portraying the company's status. They are also convenient in making comparisons with previous periods or with competitors or market leaders. Therefore, being able to interpret them correctly and see how they are interconnected or how certain actions can affect the rations - in a positive or negative way - will provide valuable insight into how the company works to the person performing the analysis.
The present paper is structured in 4 chapters, and is focused on the case-study: S.C. Policolor S.A. The reason for choosing this company is the fact that I wanted to deepen my understanding of the company, as a follow up of the three week practice period I had there last year. The first chapter provides a presentation of the company, its evolution over the years, its current situation and its products. The next chapter outlines the methodology used in performing the financial ratios analysis, as well as benchmarks that were used to determine the status of the company. Chapter 3 is the financial analysis itself, showing all the results for the main financial ratios. The results are calculated on a three year period, using the financial statements at the end of 2005, 2006 and 2007. The last chapter of the paper is made up of three action plans that Policolor could take so that improvements will occur as a result. Furthermore, the effects of these action plans are depicted in financial terms. Each action plan can determine a certain increase in the company's net profit, if the necessary measures are taken.
Chapter 1 - Company profile
With 40 years of experience in the varnish and paint market in
Beginning with 1990, the year when the Varnish and Paint Enterprise was transformed into a joint stock company under the name of Policolor S. A., the company has gradually diversified its product portfolio targeting the industrial segment as well as the household consumers one. The Policolor brands gained fame on different market segments due to their quality and especially to complex marketing strategies.
1965 - The Varnish and Paint Enterprise Bucuresti was created; the enterprise was the supplier of national industries, as well as to regular consumers;
1976 - 1990 - The Varnish and Paint
Enterprise becomes the first producer of epoxidical and unsaturated resins for
industrial use, being the only Original Equipment Manufactory producer of auto
enamel. The history of the company is closely intertwined with that of the
automobile industry, especially the
1990 - The Paint and Varnish Enterprise becomes a joint-stock company and changes its name into S.C. Policolor S.A.
1992 - A modernisation programme of the company's technology is introduced.
1997 - The shares of Policolor are listed on the Bucharest Stock Exchange.
1997 - The process of privatisation of Policolor is completed, 51% of the social capital being under the possession of the Romanian Investment Fund and Romanian American Enterprise Fund. The company benefits from important investments in the modernisation of its factories and production capacity.
1997 - The Romanian Society for Quality Assurance certifies the quality management system of Policolor, according to the SR EN ISO 9001/1995.
1998 - Policolor acquires the
majority pack of Orgachim, the largest paints and varnishes producer in
1999 - Policolor starts implementing the Environmental Management System.
1999 - The company launched the SPOR brand, which became the moment of entry on the market of decorative paints.
2001 - New brands of paints and varnishes are launched: IRIS, GATA, the Villa System (Villa Supra, Villa Prima, Villa Ground), Ecolor.
2002 - Policolor obtains the SRAC and IQNET for the Integrated Management Quality and Environmental System.
2003 - The company launched the KLAR Professional brand, made up of an array of products designed specifically for automobile paint shops. The brand becomes the market leader in less than 2 years from its launch. One of the main reasons for this success was the fact that it provides all the necessary instruments for the execution of a high quality and maximum efficiency repair.
2004 - The company opened the Policolor - Colour House chain of stores, offering, besides the classical products, a colour palette of over 1000 shades of washable paints, created with the help of colour shading equipment. The chain totals 50 stores and over 100 pieces of shading equipment
2005 - The DEKO Professional array of products was launched on the market. The array was aimed at the professional segment of the construction market. As a result, the sales of Policolor in the first 9 months after the launch increased by 200% compared to the same period of the year before.
2005 - The KLAR'ART club was set up.
The club was under the patronage of KLAR Professional brand and unites all
aerographers in
2005 - The KLAR Professional Centre was launched. The centre was destined to professional automobile paint shops. Annually, an extra 400 clients and partners are added to the existing KLAR Professional Centre network.
Policolor's shares have been traded on the Bucharest Stock Exchange since 3 December 1997. At the moment the company was listed, the number of shares was 48,925,250. Their number increased over the years through several share capital increases, as shown in Table 1.1. The total number of shares today is 71,257,475, having a nominal value of 0.1 RON each.
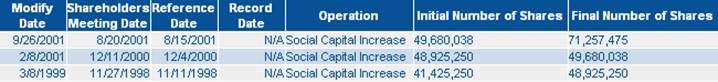 Table 1.1 - Social capital
increases of Policolor
Table 1.1 - Social capital
increases of Policolor
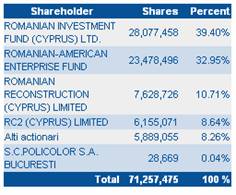 Table 1.2 shows the company's shareholder structure. The
company has 3 main shareholders, the Romanian Investment Fund (
Table 1.2 shows the company's shareholder structure. The
company has 3 main shareholders, the Romanian Investment Fund (
Table 1.2 - Shareholder structure
The evolution of the price of a Policolor share over the last 12 months has fluctuated according to Graph 1.1 below. The lowest price was 2.3 Ron, while the highest reached 4.4 RON.
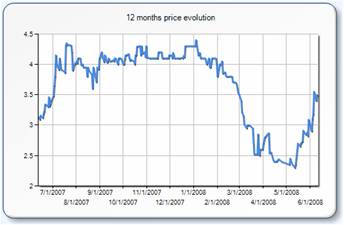
Graph 1.2 - Price evolution of Policolor shares over the last 12 months
Policolor's products fall within 3 broad categories: automotive, constructions and industry. The most popular ones are detailed below.
SILVERPOL, DURALCHID and EMAUR, painting systems for vehicles are leaders in the auto refinishing coatings market. Policolor's industrial coatings have various applicability areas: products for anticorrosive protection in high humidity environments, products for anticorrosive protection in aggressive chemical environments, products for protection in high temperatures, products for electrical insulation, refinishing products with "hammering" effect, refinishing products with relief structured aspect, coating products for metallic packages, special use resins, products for concrete floors, road marking products and fireproof systems.
KLAR Professional range of products addresses to professional auto painters (services), offering them all necessary tools for the execution of a high quality repair.
Regarding the products for the industrial coatings, they have a wide range of applicability: Products for anticorrosive protection in high humidity environments; products for anticorrosive protection in aggressive chemical environments, products for protection at high temperatures, electro-insulating products, finishing products with "hammer" effect, structured finishing systems, coating products for metallic cans, resins for special use, products for concrete floors, road marking paint and fireproof systems.
Ever since 1999, the company has been constantly launching new products to broaden the range of products intended both for the household consumers and for the construction industry: SPOR paint, SPOR varnish coming in 16 colors, Villa Prima and Villa Ultra, DECO enamel for wood, metal and masonry coming in 10 colors, colored BADULAC - satin varnish for interior wood protection, coming in three colours, IRIS - the tinting system for water based paints and enamels, available in over 700 shades, DECO - adhesive for constructions, DECO - structured paint for interior surfaces, Deco - decorative plasters, PLUS - anticorrosive mastic, PLAST - special primer as well as new colours for BADULAC, VILLA ULTRA and VILLA SUPRA.
The full list of products is
detailed below.
This section presents the main financial results of
Policolor in 2005, 2006 and 2007, as shown in Table 1.3. Indexes of the
financial results will depict the overall trend concerning the company's
evolution. These trends will also be depicted in explanatory graphs and
figures. Index![]() is computed to show the evolution from 2005 to 2006 and Index
is computed to show the evolution from 2005 to 2006 and Index![]() highlights the changes from 2006 to 2007. Thus:
highlights the changes from 2006 to 2007. Thus:
Index![]() =
= ![]()
Index![]() =
= ![]()
|
No. |
Item |
Index |
Index |
|||
|
Turnover |
90,397,468 |
108,142,983 |
140,814,388 |
1.1963054 |
1.302113 |
|
|
Sales of finished goods |
85,869,052 |
98,249,632 |
116,632,229 |
1.1441798 |
1.1871009 |
|
|
Cost of goods sold |
88,759,665 |
116,136,441 |
139,955,290 |
1.3084371 |
1.2050937 |
|
|
Profit from production (1-3) |
6,657,016 |
16,367,664 |
9,510,752 |
2.4587088 |
0.5810696 |
|
|
Financial income |
2,044,412 |
3,073,957 |
1,973,293 |
1.5035898 |
0.641939 |
|
|
Financial expenses |
2,782,679 |
2,549,486 |
1,272,072 |
0.9161984 |
0.4989523 |
|
|
Financial profit (5-6) |
-738,267 |
524,471 |
701,221 |
-0.710408 |
1.3370062 |
|
|
Total income (4+7) |
5,918,749 |
16,892,135 |
10,211,973 |
2.8540043 |
0.6045401 |
|
|
Total expenses (3+6) |
91,542,344 |
118,685,927 |
141,227,362 |
1.296514 |
1.1899251 |
|
|
Total profit before tax (4+7=8-9) |
5,918,749 |
16,892,135 |
10,211,973 |
2.8540043 |
0.6045401 |
|
|
Net profit |
4,222,574 |
14,202,050 |
8,529,927 |
3.3633632 |
0.6006124 |
Table 1.3 - Main financial results
 The following graphs are depictions of the
trends of the main financial results of Policolor.
The following graphs are depictions of the
trends of the main financial results of Policolor.
Graph 1.3 - Trends of turnover, sales of finished goods and Cost of goods sold
Graph 1.4 - Trends of Profit from production, Financial income, Total income and Net profit
Graph 1.5 - Indexes of Turnover, Cost of goods sold, Total Income, Total expenses and Net profit
All these graphs show that the company's results fluctuated from year to year. Generally, there was an increase from 2005 to 2006, followed by a decrease from 2006 to 2007. Unfortunately, the company was not able to repeat its performance from 2006 in the next year, but all results are still better than the ones from the first financial period analysed.
Chapter 2 - Financial ratios Methodology
Financial ratios or accounting ratios are ratios of selected values on an enterprise's financial statements. There are many standard ratios used to evaluate the overall financial condition of a corporation or other organization. Financial ratios are used by managers within a firm, by current and potential shareholders (owners) of a firm, and by a firm's creditors. Security analysts use financial ratios to compare the strengths and weaknesses in various companies. If shares in a company are traded in a financial market, the market price of the shares is used in certain financial ratios.
Financial ratios are based on summary data presented in financial statements. This summary data is based on the accounting method and accounting standards used by the organization. Ratios are expressed as a decimal value, such as 0.10, or the equivalent percent value, such as 10%.
Financial ratios quantify many aspects of a business and are an integral part of financial statement analysis. Financial ratios are categorized according to the financial aspect of the business which the ratio measures. Liquidity ratios measure the availability of cash to pay debt. Asset management ratios measure how quickly a firm converts non-cash assets to cash assets. Leverage (or gearing or debt) ratios measure the firm's ability to repay long-term debt. Profitability ratios measure the firm's use of its assets and control of its expenses to generate an acceptable rate of return. Market value ratios measure investor response to owning a company's stock and also the cost of issuing stock.
Financial ratios allow for comparisons
The ratios of firms in different industries, which face different risks, capital requirements, and competition are not usually comparable.
Liquidity ratios are a measure of the ability of a company to pay its debts as and when they fall due, being an indicator of the availability of cash or assets that can easily be turned into cash.
There are four liquidity ratios detailed below: the current ratio, the quick ratio (acid test or liquid ratio), the average collection period, and the cash flow liquidity.
Current ratio
![]()
The current ratio is an indication of a firm's market liquidity and ability to meet creditor's demands. It roughly measures the company's potential reservoir of cash. Acceptable current ratios vary from industry to industry. If a company's current assets are in this range, then it is generally considered to have good short-term financial strength. If current liabilities exceed current assets (the current ratio is below 1), then the company may have problems meeting its short-term obligations. If the current ratio is too high, then the company may not be efficiently using its current assets.
Rapid decreases in the current ratio sometimes signify trouble. For example, a firm that drags out its payables by delaying payment of its bills will suffer an increase in current liabilities and a decrease in the current ratio.
Changes in the current ratio can mislead, however. For example, suppose that a company borrows a large sum from the bank and invests it in marketable securities. Current liabilities rise and so do current assets. Therefore, if nothing else changes, net working capital is unaffected but the current ratio changes. For this reason, it is sometimes preferable to net short-term investments against short-term debt when calculating the current ratio.
Quick ratio (acid test or liquid ratio)
![]()
This ratio measures the ability of a company to use its near cash or quick assets to immediately extinguish its current liabilities. Quick assets include those current assets that presumably can be quickly converted to cash at close to their book values. Such items are cash, marketable securities, and some accounts receivable. This ratio indicates a firm's capacity to maintain operations as usual with current cash or near cash reserves in bad periods. As such, this ratio implies a liquidation approach and does not recognize the revolving nature of current assets and liabilities. The ratio compares a company's cash and short-term investments to the financial liabilities the company is expected to incur within a year's time.
Average Collection Period
![]()
The average collection period measures the speed with which customers pay their bills. It expresses accounts receivable in terms of daily sales and highlights the average number of days customers take to pay their bills, indicating the effectiveness of credit and collection policies of the business. This ratio also determines if the credit terms are realistic.
The average collection period measures the length of time it takes to convert the company's sales or turnover, into cash. This measurement defines the relationship between accounts receivable and the cash flow. A longer average collection period requires a higher investment in accounts receivable. A higher investment in accounts receivable means less cash is available to cover cash outflows, such as paying bills. One of the immediate advantages of understanding average collection periods is that the information allows the company to anticipate cash flow generated by services rendered. Another valuable usage of calculating the average collection period is that the company can spot unfavorable trends early on. If the average collection period for the same time last year was 34 days and it is now up to 42 days, the situation bears investigation.
Asset management ratios measure how quickly a company converts non-cash assets to cash assets.
The accounts receivable turnover, the inventory turnover, the accounts payable turnover and the asset turnover are asset management ratios.
Accounts Receivable Turnover ratio
![]()
It is a measure used to quantify a firm's effectiveness in extending credit as well as collecting debts. The receivables turnover ratio is an activity ratio, measuring how efficiently a firm uses its assets. The result indicates how quickly customers are paying the company. The greater the number of times receivables turn over during the year, the shorter the time between sales and cash collection.
By maintaining accounts receivable, firms are indirectly extending interest-free loans to their clients. A high ratio implies either that a company operates on a cash basis or that its extension of credit and collection of accounts receivable is efficient.
A low ratio implies the company should re-assess its credit policies in order to ensure the timely collection of imparted credit not earning interest for the firm.
Inventory Turnover ratio
![]()
This ratio measures the number of times, on average, the inventory is sold during the period. Its purpose is to measure the liquidity of the inventory. Efficient companies turn over their inventory rapidly and don't tie up more capital than they need in raw materials or finished goods. The lowest the result for this ratio, the better.
Accounts Payable Turnover
![]()
This ratio represents a short-term liquidity measure used to quantify the rate at which a company pays off its suppliers. Accounts payable turnover ratio is calculated by taking the total purchases made from suppliers and dividing it by the average accounts payable amount during the same period.
The measure shows investors how many times per period the company pays its average payable amount. If the turnover ratio is falling from one period to another, this is a sign that the company is taking longer to pay off its suppliers than it was before. The opposite is true when the turnover ratio is increasing, which means that the company is paying of suppliers at a faster rate.
Asset Turnover
![]()
This ratio shows the amount of sales generated for every monetary unit worth of assets and thus measures the efficiency of a company's use of its assets in generating sales revenue or sales income to the company. As it is an indicator of the company's efficiency at using its assets in generating sales or revenue - the higher the result, the better. It may also be used as an indicator of the company's pricing strategy: companies with low profit margins tend to have high asset turnover, while those with high profit margins have low asset turnover.
These ratios measure the firm's financial leverage or its ability to repay long-term debt. They all highlight the extent of the company's financing with debt and are an indicator of the riskiness of the company. The more the company is using debt, rather than equity financing, the more risky it becomes in the eyes of creditors, potential investors and other stakeholders. Financial Leverage, Debt to Equity and Debt to Assets are three leverage ratios.
Financial Leverage Ratio
![]()
Financial Leverage is a measure of how much of the company's assets are financed through equity, or through own funds, and not creditor's funds. Generally, management tends to prefer equity financing over debt since it carries less risk. A company that has a low financial leverage ratio is considered safe by creditors, who can clearly see that the company doesn't use as much debt financing which is an advantage if the company wishes to get a loan from the creditors. In this case, there are less chances that the loan installments being delayed because of other more stringent credits.
Debt to Equity Ratio
![]()
The ratio is indicating the relative proportion of equity and debt used to finance a company's assets. This ratio is also known as Risk, Gearing or Leverage. It is equal to total debt divided by shareholders' equity. The two components are often taken from the firm's balance sheet or statement of financial position (so-called book value), but the ratio may also be calculated using market values for both, if the company's debt and equity are publicly traded, or using a combination of book value for debt and market value for equity.
A high debt/equity
ratio generally means that a company has been aggressive in financing its
growth with debt. This can result in volatile earnings as a result of the
additional interest expense.
If a lot of debt is used to finance increased operations (high
debt to equity), the company could potentially generate more earnings than
it would have without this outside financing. If this were to
increase earnings by a greater amount than the debt cost (interest), then the
shareholders benefit as more earnings are being spread among the same
amount of shareholders. However, the cost of this debt financing
may outweigh the return that the company generates on the debt through
investment and business activities and become too much for the company to
handle. This can lead to bankruptcy, which would leave shareholders with
nothing.
The debt/equity ratio also depends on the industry in which the company operates. For example, capital-intensive industries such as auto manufacturing tend to have a debt/equity ratio above 2, while personal computer companies have a debt/equity of under 0.5.
Debt to Assets Ratio
![]()
This is a metric used to measure a company's financial risk by determining how much of the company's assets have been financed by debt. Calculated by adding short-term and long-term debt, and then dividing by the company's total assets. This ratio looks at what debt the company owes, and compares that debt to what assets the company owns.
This is a very broad ratio as it includes short- and long-term debt as well as all types of assets whether tangible or not The lower the Debt to Asset Ratio, the better, as companies with high amounts of debt introduce more risk. Companies that have more Total Liabilities than Total Assets should be thoroughly examined, as this is a precarious position for a company to be in. Depending on the industry of the company, one might expect the company to have two or three times as many assets as liabilities. Anything less than this might be a signal that the company is running into trouble.
Profitability ratios measure the firm's use of its assets and control of its expenses to generate an acceptable rate of return. Return on Equity, Return on Assets, Operating Profit Margin, Gross Profit Margin, Net Profit Margin, Cash Flow Margin and Cash Return on Assets are profitability ratios.
Return on Equity
![]()
This ratio measures the rate of return on the ownership interest (shareholders' equity) of the common stock owners. ROE is viewed as one of the most important financial ratios because it shows a company's efficiency at generating profits from every dollar of net profit, and shows how well a company uses investment dollars to generate earnings growth. Another interpretation is that Return on Equity describes how well contributions from stockholders generated earnings for the company, or profit.
A company wants to maximize its use of stockholder's equity, as it is the stockholders the company must answer to on how they spent the stockholder's money. Return on Equity basically shows how any dollars of earnings were generated per dollar of equity the stockholder's provided.
Return on Assets
![]()
Also called Return on Total Investment, or ROI, the Return on Total Assets measures the Net Profit in relation to the Total Assets. The Return on Total Assets identifies how well the investments of the company (the Total Assets) have generated earnings (Net Profit) back to the company.
A good strategy would be for a company to strictly control major purchases, attempting to limit those that will best bring a return in greater revenue to the company. The Return on Total Assets is a useful way to measure how well the company is actually able to make intelligent choices on how to spend its money on new assets.
This number tells you "what the company can do with what it's got", or how many dollars of earnings they derive from each dollar of assets they control. It's a useful number for comparing competing companies in the same industry. The number will vary widely across different industries. Return on assets gives an indication of the capital intensity of the company, which will depend on the industry; companies that require large initial investments will generally have lower return on assets.
Return on assets is an indicator of how profitable a company is before leverage, and is compared with companies in the same industry. Since the figure for total assets of the company depends on the carrying value of the assets, some caution is required for companies whose carrying value may not correspond to the actual market value. Return on assets is not useful for comparisons between industries because of factors of scale and peculiar capital requirements (such as reserve requirements in the insurance and banking industries).
Operating Profit Margin
![]()
This reveals the operating efficiency of the company - how well the company can convert its sales into profits from its day-to-day activities by its core operations. A good operating margin is needed for a company to be able to pay for its fixed costs, as interest on debt.
The higher the Profit Margin, the more efficient the company's core business. This ratio is interesting to compute between two or more competing companies in the same industry - to view which has the most efficient operations.
Gross Profit Margin
![]()
The Gross
Profit Margin measures the Gross Profit in relation to Turnover. This
will reveal how much profit remains out of each dollar of sales, or how much of
the turnover is reflected by gross profits.![]()
The higher the Gross Profit Margin, the better the company is able to control costs - either by reducing the costs of production of their products or services, or passing some of the costs to the customer.
Net Profit Margin
![]()
This ratio shows the proportion of revenue that finds its way into profits. After all the bills are paid and expenses covered, this ratio measures how much net profit remains out of each dollar of sales. This ratio is important to calculate, but one needs to look at Gross Profit Margin and Operating Profit Margin in order to analyse the big picture of how well the company is doing.
As with the other margin ratios, the higher the Net Profit Margin, the better. Taxes, Interest, and expenses not associated with operations will lower this ratio compared to the other margin ratios.
Cash Flow Margin
![]()
This ratio balances cash flows from operating activities and the company's turnover, measuring the ability of the company to turn sales into cash.
It is cash that a company needs to generate to pay its expenses and purchase assets, and how well a company can convert sales into cash is crucial. Knowing that a company is continually improving its Cash Flow Margin is extremely valuable and is a key indicator of performance. Companies that end up generating a negative cash flow are losing money as they generate sales and any company cannot keep this up over an extended period of time. With a negative cash flow, the company will have to rely on cash reserves or take on more debt as they continue the business. The term "burn-rate" is often used to describe a company operating with negative cash flows - basically describing that the company is "burning" through its cash reserves.
Cash Return on Assets
![]()
The Cash Return on Assets measures the Cash Flow from Operating Activities in relation to Total Assets. Cash Return on Assets basically shows how well (or how poorly) the company is generating cash from its asset investments. Similar to Return on Total Assets, the company hopes to generate as much revenue as possible from its assets.
This calculation is especially important to evaluate companies with large investments in assets, such as manufacturing and processors of raw materials. These companies need to maximize their investments, as new manufacturing plants and off-shore oil drilling rigs are critical investments and purchases of big-ticket items like these are large enough to alter financial statement results significantly.
Ratios in this category are designed to measure a company's ability to generate revenues and control costs.
Operating Expense Ratio
![]()
The ratio shows the percentage of turnover that is used for covering operating expenses. The rest of up to 100% will be used to cover debt servicing, reinvestments and dividend payment.
This ratio is usually viewed as a measurement of management efficiency. This is because management usually has greater control over operating expenses than they do over revenues.
The lower the result, the better. When viewed over time, the operating expense ratio can show if management can expand operations without dramatically increasing expenses. For example, if sales were to expand from year to year and the operating expense ratio goes down, this would mean that sales increased, and operating expense went down at an even faster rate. This would be a very positive situation from a net income standpoint.
Interest Expense Ratio
![]()
This ratio relates the interest expense to a company's ability to generate income. It is particularly useful in trend analysis, as an upward trend is an indicator that the company may be headed to eventual financial stress.
Market ratios measure investor response to owning a company's stock and also the cost of issuing stock.
Earnings per Share
![]()
The result expresses how much earnings has been generated per one share of stock during the period reported. As a company's earnings increase, Earnings per share will look better, but keep in mind other things can affect Earnings Per Share: share buybacks the company may conduct (resulting in less shares), or the company releasing more shares, which increases the number of total shares further diluting the Net Earnings.
Price to Earnings Ratio
![]()
This ratio is also called the PE or P/E ratio, the Price to Earnings Ratio compares the Market Price of Common Stock to the Earnings Per Share. It is a quick measure of how "expensive" the stock of a company may be. It is an indicator of the price paid for a share relative to the annual income or profit earned by the firm per share. A higher P/E ratio means that investors are paying more for each unit of income.
By comparing price and earnings per share for a company, one can analyze the market's stock valuation of a company and its shares relative to the income the company is actually generating. Investors can use the P/E ratio to compare the value of stocks: if one stock has a P/E twice that of another stock, all things being equal (especially the earnings growth rate), it is a less attractive investment. A company's stock may be heard as being "overvalued" - this ratio is the calculation often behind analyses like that. As the Earnings Per Share increase, or the Market Price of Common Stock decrease, the ratio will look better.
Table 2.1 below illustrates different value intervals for the most important financial ratios. In case the result of a financial ratio can be classified under the "green" column, the company is doing well. If it is classified under "yellow", then there is no cause for concern. A "red" result shows that the company is doing something wrong and action must be taken in order to improve the current situation and turn the result into a "yellow" or a "green" one.
|
Ratio name |
Green |
Yellow |
Red |
|
Current ratio |
>1.50 |
1.00 to 1.50 |
<1.00 |
|
Acid test ratio |
>1.90 |
0.60 to 1.90 |
<0.60 |
|
Average collection period |
<42 |
42 to 78 |
>78 |
|
Inventory turnover ratio |
>12 |
4.60 to 12 |
<4.6 |
|
Asset turnover ratio |
>2.20 |
1.40 to 2.20 |
<1.4 |
|
Debt to equity ratio |
<42% |
42 % to 122% |
>122% |
|
Debt to assets ratio |
<30% |
30% to 55% |
>55% |
|
Equity to assets ratio |
<180% |
180% to 330% |
>330% |
|
Operating profit margin |
>25% |
10% to 25% |
<10% |
|
Return on assets |
>5% |
1% to 5% |
<1% |
|
Operating expenses ratio |
<65% |
65% to 80% |
>80% |
Table 2.1 - Benchmarks for financial ratios analysis
Chapter 3 - Analysis of Policolor's Financial Ratios
|
Financial Ratio | |||
|
Current Ratio |
1.44 |
2.31 |
2.87 |
|
Acid Test Ratio |
0.64 |
1.30 |
1.20 |
|
Average Collection Period |
67 |
51 |
58 |
Table 3.1 - Results for Policolor's liquidity ratios
Graph 3.1 - Current and Acid Test Ratios Graph 3.2 - Average Collection Period
The table above shows the results for the three liquidity ratios: the Current Ratio, the Acid Test and the Average Collection Period.
The Current Ratio has had an increasing trend over the three accounting periods. If we are to compare the results to the benchmarking values presented in table 2.1, the value of the ratio in the first year is in the yellow area, and, after the increase, the values are situated in the green area, so, the evolution was positive. While in 2005, Policolor had 1.44 times more current assets than current liabilities, in 2007, the ratio increased to 2.87 times more current assets than current liabilities, therefore doubling in size. This is a very good situation for the company, since it shows the short-term financial strength of the company and underlines its high liquidity and the fact that there will be no obstacles for Policolor to cover its short-term liabilities.
The Acid Test ratio also has a positive evolution for the company, even though the trend was not an increasing one over the years. In 2005, Policolor had 0.64 RON in liquid assets for each RON in current liabilities. The company did not possess enough near cash items to fully extinguish its current liabilities and also relied on less liquid assets to meet short-term debt. Although the situation was not a difficult one, it improved. In 2006, Policolor reached a level of 1.3 RON in liquid assets for each RON in current liabilities. The next year, there was a decrease in the result by 0.1. The benchmarking values in table 2.1 indicate that in all three years, the company did not manage to escape the yellow area, even though the value of the Acid Test Ratio increased, and so did the company's liquidity.
The last of the liquidity ratios, the average collection period, also depicts a somewhat favourable situation. The best result was obtained in 2006, when it only took Policolor an average of 51 days to collect the debts of their customers. The next year, the period was an average 7 days longer, but the situation was still better than in 2005, when the company collected accounts receivable in around 67 days. Once more, the company's results fall in the "yellow" category, since they are situated in the interval 42 to 78 days.
|
Financial Ratio | |||
|
Accounts Receivable Turnover |
5.46 |
7.09 |
6.32 |
|
Inventory Turnover |
3.63 |
4.27 |
3.93 |
|
Accounts Payable Turnover |
6.98 |
7.80 |
9.46 |
|
Asset Turnover |
2.10 |
1.78 |
2.05 |
Table 3.2 - Results for Policolor's asset management ratios
Graph 3.3 - Asset management ratios
The figures in Table 3.2 show the results for the asset management ratios, depicting the company's position concerning how well Policolor is at converting non-cash items to cash items.
The Accounts Receivable Turnover has a trend that can be predicted based on the trend of the average collection period. The higher the result for this ratio, the less it takes for the company to cash in what its clients owe. Therefore, the higher the Accounts Receivable Turnover, the shorter the Average Collection Period. As expected, the worst result was obtained in 2005 and the best in the next year. In 2005, the company was able to turn its receivables 5.46 times, in 2006, receivables were turned 7.09 times and in 2007, 6.32 times. This is exactly the same evolution that the Average Collection Period had, presenting a positive outcome from 2005 to 2006 and a negative outcome from 2006 to 2007.
The results for the Inventory Turnover Ratio are the following: in 2005, Policolor sold its inventory 3.63 times during the period, in the next year, inventory was sold 4.27 times and in the last year, 3.93 times. This ratio is a depiction of the company's inefficiency in tying up more capital than they need in inventory. The very low results show a poor management of assets and they should raise concern, because they clearly fall in the "red" value interval. These results could be explained through poor sales, and therefore, excess inventory.
The Accounts Payable Turnover has an extremely good evolution, and the fact that it increased considerably over the years is a fact that makes the company be valued in the eyes of creditors. The rate at which Policolor pays its accounts payable has increased from 6.98 to 7.80 and further on to 9.46. Therefore, the company managed to increase its efficiency in terms of converting payables into cash.
The Asset Turnover ratio has had a fluctuating evolution over the three accounting periods. In the first one, Policolor generated 2.1 RON for every RON of assets, in the second period, it generated 1.78 RON, while in the third, it rose to 2.05. The figures are all in the "yellow" range, which is between 1.4 and 2.2.
|
Financial Ratio | |||
|
Financial Leverage Ratio |
1.08 |
1.04 |
1.03 |
|
Debt to Equity Ratio |
8.10% |
4.47% |
3.16% |
|
Debt to Assets Ratio |
17.21% |
14.10% |
13.05% |
Table 3.3 - Results for Policolor's financial leverage ratios
Graph 3.4 - Financial Leverage Ratio Graph 3.5- Debt to Equity and Debt to Assets
Table 3.3 shows the results of the company's financial leverage ratios, measuring the company's ability to pay its long term debt.
The results for the Financial Leverage ratio show that the amount of the company's total assets are slightly the same as the amount of its owner's equity. In 2005, for each 1.08 RON in assets, Policolor used 1 RON of equity financing. In 2006, 1 RON of equity financing was used for 1.04 RON of assets, and in 2007 for 1.03 RON of assets.
As for the debt to equity ratio, it also had a descending evolution. In 2005, 8.10% of the company's funds were in the form of debt. This percentage decreased to 4.47% in 2006 and even more to 3.16% in 2007. Over time, the company used less and less debt to finance its operations. This is translated into a less risky company, because it will not be in the situation where it cannot pay back one loan because of its other loans. Another advantage of this decrease is the fact that less interest will be paid by the company.
The last of the financial leverage ratios also shows a descending evolution. In Policolor's case, less and less debt was used to finance the company's assets: 17.21% in 2005, 14.10% in 2006 and 13.05% in 2007. This is the same conclusion the debt to equity ratio pointed to.
|
Financial ratios | |||
|
Return on Equity |
10.63% |
24.53% |
12.86% |
|
Return on Assets |
9.83% |
23.48% |
12.46% |
|
Operating Profit Margin |
7.36% |
15.14% |
6.75% |
|
Gross Profit Margin |
6.55% |
15.62% |
7.25% |
|
Net Profit Margin |
4.67% |
13.13% |
6.06% |
|
Cash Flow Margin |
-3.12% |
4.29% |
-4.39% |
|
Cash Return on Assets |
15.50% |
27.06% |
13.89% |
Table 3.4 - Results for Policolor's profitability ratios

Graph 3.6 - Profitability Ratios
Table 3.4 presents the company's situation in terms of profitability.
The first ratio to analyse is Return on Equity, which shows increases and decreases. The best result was obtained in 2006, when, for each monetary unit invested by the shareholder, 24.53% was returned in the form of earnings. As is the case with many of the other indicators, the result in 2007 (12.86% was returned as earnings to shareholders) was less favourable than that of 2006, but more favourable than that of 2005 (only 10.63% was returned as earnings).
The Return on Assets ratio for the first financial period analysed shows that 9.83% out of each RON invested in assets was returned in the form of net profit. In the second financial period, the return more than doubled, reaching 23.48%, while in the last period, there was a decrease to 12.46% return out of each RON invested in assets.
As for the Operating Profit Margin, it shows the company's ability to control costs and make a return on the sales obtained. Results show that in 2005, for every monetary unit of sales, the company generated 0.0736 RON of operating profits. In 2006, the company generated more, reaching an amount of 0.1514 RON and in 2007, 0.0675 RON. In the first and last case, the results are in the "red" interval, showing that the company needs to improve the efficiency of its core operations, perhaps through decreasing fixed costs.
The Gross Profit Margin is another measure of the company's ability to get a return on sales. The best result is in 2006, when Policolor generated 0.1562 RON of gross profit out of each RON of sales. The other two results were well below this level: 0.0655 RON generated in 2005 and 0.0725 RON generated in 2006.
Net Profit Margin is a somewhat more refined analysis tool compared to the Gross Profit Margin, since it takes into account the Net Profit instead of the Gross Profit. The trend of the results can be anticipated based on the trend of the previous ratio. The highest figure is in 2006 (0.1313 RON of net profit generated out of 1 RON of sales), and less in the other two years: 0.0467 RON generated in 2005 and 0.0606 generated in 2006.
The Cash Flow margin shows the fact that Policolor is not a company that finds itself at ease when it comes to turning sales into cash. The fact that the company generated a negative cash flow from operations in 2005 and 2007 was translated into results for the present ratio smaller than 0. The company managed to go over this threshold in 2006, when 0.0429 RON out of 1 RON of sales were turned into cash.
The last ratio out of the Profitability Ratios set is Cash Return on Assets. From every RON invested in assets by Policolor, different amounts are returned to the company in the form of cash, respectively for the three accounting periods: 0.155 RON, 0.2706 RON and 0.1389 RON.
|
Financial Ratio | |||
|
Operating Expense Ratio |
98.18% |
107.39% |
99.38% |
|
Interest Expense Ratio |
0.0179 |
0.0105 |
0.0015 |
Table 3.5 - Results for Policolor's financial efficiency ratios
Graph 3.7 - Operating expense Ratio Graph 3.8 - Interest Expense Ratio
This set of ratios help determine the financial efficiency of Policolor.
The first ratio, the Operating Expense Ratio, points out the fact that the company has an extremely high level of operating expenses. When balanced with the turnover, the two are almost equal, sometimes the operating expenses are higher than the turnover. In 2005 and 2007, 98.18%, respectively 99.38% out of every RON of revenue generated was used for covering operating expenses. The rest of up to 100% were left for covering debt servicing, reinvestments and dividend payments. In 2006, the turnover was not sufficiently large to cover operational expenses. The company also used other sources of income to make up for the gap in between the two items.
The results of the Interest Expense Ratio have small values, which could have been anticipated, since Policolor uses equity as a main source of financing the company. Therefore, the level of debt financing is low and so is the interest expense paid for these sources of financing. Moreover, the trend is a decreasing one over time because less interest is paid every year. In 2006, 1.79% out of each RON of revenue generated covered interest expense. The next year, the figure decreased to 1.05% and then even more 0.15%.
|
Financial Ratio | |||
|
Earnings per Share |
0.08 |
0.28 |
0.17 |
|
Price to Earnings Ratio |
1.38 |
0.72 |
1.87 |
Table 3.6 - Results for Policolor's market value ratios
Graph 3.9 - Market Value Ratios
The last set of ratios measure Policolor's market value.
The Earnings per Share ratio is directly proportional to the net profit of the company, which is assumed to be distributed yearly as dividends to its shareholders. Taking into account that the highest net profit was registered in 2006, the same is valid for the ratio: the highest result is in that year (0.28 RON).
The Price to Earnings Ratio shows the fact that in 2005 and 2007, the price of stock is higher than the earnings that the stocks pass on to shareholders. This is a positive situation, since it means that people are willing to pay more for a share which, therefore, has a higher perceived value for potential shareholders.
Conclusions
Taking into consideration the company's evolution over the three financial periods, it is clear that there was a fluctuation in the results for the financial ratios. With a few exceptions, the best results were registered by Policolor in 2006. Unfortunately, the overall situation was less favourable in 2007, but, if we are to compare the results of 2007 and those of 2005, the company was slightly better off in the former financial period.
|
Ratio name | |||
|
Current ratio | |||
|
Acid test ratio | |||
|
Average collection period | |||
|
Inventory turnover ratio | |||
|
Asset turnover ratio | |||
|
Debt to equity ratio | |||
|
Debt to assets ratio |
| ||
|
Equity to assets ratio | |||
|
Operating profit margin | |||
|
Return on assets |
Table C.1 - Results of main ratios compared to industry benchmarks
The liquidity section of the financial ratios depicts the fact that the company is in a pretty good situation. The Current Ratio had an increasing trend and since it is over 1.5, there is no concern that the company cannot repay its short term debts using its own resources. The Acid Test is not as impressive, but it is a good result, which implies there is a high level of inventories. As for the Average Collection Period, it could be improved in the future.
The asset management ratios show the fluctuation described above, then best result being registered in 2006. As suggested by the liquidity ratios, the company has a lot of capital in their inventory. These are resources that are not used at their potential and affect the company's overall image in terms of ratios. The increase in Accounts Payable Turnover shows that the company is valued by its creditors. The Asset Turnover Ratio, although fluctuating, has pretty good results, suggesting that the company has a good management of its assets and this is reflected in the turnover.
As for the Financial Leverage Ratios, these portray the way in which Policolor finances its operations and implicitly, the company's ability to repay long term debt. The calculations imply that the company mostly uses internal sources of financing, and prefers to use debt financing less. Hence, the company is viewed as a safe client by long term creditors. Due to the fact that it does not have large amounts of money to pay for long term credits, banks or other lenders would be willing to loan to the company. Another advantage of using less debt financing is the fact that the interest expenses and expenses with other bank fees (which can be quite large for transactions made by a company of this size) are smaller.
The profitability ratios depict a less impressive picture. The best result was obtained in the Return on Assets category. This suggests that the current investment strategy in assets had a positive outcome and it has generated earnings (Net Profit) back to the company. The company got the worst result for its Cash Flow Margin, because of the fact that the company had negative cash flows from operations in 2005 and in 2007, when outflows surpassed inflows.
The next category of ratios reflects the financial efficiency of the company. The Operating Expense Ratio, points out the fact that the company has an extremely high level of operating expenses and very little is left for were left for covering debt servicing, reinvestments and dividend payments. The results of the Interest Expense Ratio have small values, which could have been anticipated, since Policolor uses equity as a main source of financing the company. Therefore, the level of debt financing is low and so is the interest expense paid for these sources of financing.
For the last set of ratios, out of the two (Earnings per Share and Price to Earnings Ratio), the company had a better result in the latter. The calculations illustrate the fact that the potential buyers are willing to pay more for a share of Policolor. This is an important indicator, since the company is also registered on the Stock Market and the way it is perceived by potential buyers affects the price of the shares.
Taking into account the conclusions above, the next chapter formulates 3 action plans that suggest measures that can be taken by the management of Policolor in order to imrove some of the company's weak spots.
Chapter 4 - Action Plans
Based on the financial ratios analysis presented in the previous chapter, some of Policolor's weak spots were pinpointed and action plans can be drawn up for improving the company's current situation by finding solutions to the problems it is faced with.
One of the easiest things a company can do is to improve liquidity through cashing in its accounts receivable sooner than in the past. This is a measure than implies minimum resources from the company in terms of personnel, money or equipment, but must be performed in a repetitive manner, for each customer the company has. Fortunately, Policolor deals mostly with large customers on a retail basis, and less with individual consumers, natural persons. Therefore, this action plan is a plausible and easy to follow up on measure to improve the company's performance.
In order to determine its clients to pay bills sooner, there are some measures that Policolor should take. This procedure should be repeated for each invoice. When half the payment period stipulated in the contract has elapsed, an e-mail or fax should be sent to the client informing of that fact and kindly asking for payment of the invoice. If the payment is not settled, this practice should be repeated constantly and at regular intervals, so that there are more chances that customers' debt is collected in less days. It is vital that all communication should be performed in written form and not orally, so that there is proof of the repetitive urges of Policolor.
By collecting accounts receivable in less days, the company's liquidity increases, as more cash is made available sooner for payments to creditors. Another positive effect is shown in the cash balance. As is depicted in Table 3.4, Policolor had negative cash flow from operations in 2005 and 2007. Collecting receivables faster improves the cash flow situation. Moreover, some of the company's financial ratios will be improved.
The following calculus illustrates the effects of this action plan in the financial statements. By taking all the measures described above, the average collection period will decrease from an average of 58 days (the result of 2007) to an average of 48 days.
∆Days = 58 - 40 = 10 days
The 10 day difference is translated into an availability of cash calculated using the formula:
Cash available = ![]()
All the company's sales of finished goods in the respective year was at one point part of the accounts receivable item. Therefore, the cash available is of RON 3,911,510.8 for an entire year.
By increasing liquidity, Policolor was able to use the cash available to make payments due to creditors. Otherwise, the company would have had to find other sources of financing, such as a credit. Assuming that the annual interest rate is of 9% and all the yearly bank fees amount to 1%, Policolor was able to save approximately RON 391,150 in interest expenses. This sum directly influences the company's profit in a positive way and also improves the results of all ratios computed using the profit as an indicator.
Policolor owns
several halls located at their facility on
These halls could be of use for the company and could even become a source of regular cash inflows. The steps that the company must take are to sell all the old equipment, pipes and any other metal to scrap metal and afterwards rent the hall for as long a period as possible.
To illustrate how this action plan can improve the company's situation, the following figures are used in calculating the effects: The company will only use one hall out of the ones it owns in this action plan. The hall has a 1,000 sqm surface and houses a total of 2,000 tons of old equipment and other metal. The price of 1 ton of scrap metal is RON 1000. The expenses for gathering and transporting the scap metal to the destination is of RON 300/ton. Therefore, the net price for one ton of scrap metal would be of RON 700. The rental price for the hall is of EUR 5 per sqm per year, meaning RON 18 per sqm.
Therefore, the company will make RON 1,400,000 by selling the scrap metal (net price x quantity) and, assuming that the rental contract for the empty hall is concluded in the beginning of the year for a period of more than 1 year, an additional sum of RON 216,000 in the first year will be generated. The total of RON 1,616,000 are directly reflected in the company's profits which will increase with that exact sum, shown in the operating section of the profit and loss account.
This action plan is aimed at improving the company's productivity. Let us suppose that a new piece of equipment for mixing the raw materials to produce paint is launched on the market. By acquiring this equipment, the company will be able to make some savings. This machine can be handled by only one person, as opposed to the four who are now operating a similar machine in Policolor. This decrease of personnel means a drop of costs with salaries. The new equipment is more cost effective because it uses less electricity in the production process. Hence, the fix costs of the company will also decrease. Furthermore, it produces 10% more paint in one year than the old machine. Since there is demand on the market for the company's products, this means that there will be an increase in Policolor's profit, according to the company's profit margin.
The figures allotted to this action plan are as follows: average salary of a worker on that machine is RON 1,200. The machine uses 30,000 less kWh per year. The price of 1 kWh is RON 0.2.
Salary costs will therefore be decreased by RON 3,600 per month for the three persons that are no longer needed. For the entire year, the total decrease is of RON 43,200. Fixed costs will decrease with RON 6,000 for the entire year.
Since the company will produce 10% more paint which will be absorbed by the market, there will be a 10% increase in turnover, which will reach a level of RON 154,895,826. Taking into account that the company's Net Profit Margin in 2007 was of 6.06%, this means that 6.06% of the company's turnover is translated into Net Profit, which will reach RON 9,386,687.
∆Profit = RON 9,386,687 - RON 8,529,927 = RON 856,760
The overall increase in the profit if this action plan is taken is the sum of the results above, reaching a level of RON 905,960.
The table below summarises the effects of the three action plans.
|
Action Plan |
Item |
Amount (RON) |
Total per action plan |
|
Cashing in receivables sooner |
391,150 |
391,150 |
|
|
Selling scrap metal |
1,400,000 |
1,616,000 |
|
|
Renting the hall |
216,000 |
||
|
Decrease in salary costs |
43,200 |
905,960 |
|
|
Decrease in fixed costs |
6,000 |
||
|
Increase in net profit |
856,760 |
||
|
TOTAL |
2,913,110 |
Table 4.1 - Summary of action plan effects in the profit
Bibliography
Annexes
|
Item | |||
|
Total assets |
42,938,317 |
60,488,343 |
68,449,874 |
|
Fixed assets |
29,511,782 |
25,356,123 |
28,637,188 |
|
Inventory |
24,420,455 |
27,182,972 |
35,598,411 |
|
Accounts receivable |
16,545,052 |
15,254,458 |
22,265,948 |
|
Cash and bank accounts |
2,489,184 |
19,193,385 |
3,285,951 |
|
Total current assets |
43,459,775 |
61,635,899 |
61,150,460 |
|
Short-term liabilities |
30,236,103 |
26,706,099 |
21,369,826 |
|
Long term liabilities |
2,058,747 |
1,184,220 |
1,041,490 |
|
Owner's equity |
39,722,660 |
57,899,179 |
66,353,102 |
|
Accounts payable |
12,711,275 |
14,882,249 |
14,780,189 |
|
Item | |||
|
Turnover |
90,397,468 |
108,142,983 |
140,814,388 |
|
Total revenue from operations |
95,416,681 |
132,504,105 |
149,466,042 |
|
Expenses from operations |
88,759,665 |
116,136,441 |
139,955,290 |
|
Result from operations |
6,657,016 |
16,367,664 |
9,510,752 |
|
Interest expenses |
1,615,212 |
1,132,042 |
215,700 |
|
Result from financial operations |
(738,267) |
524,471 |
701,221 |
|
Total revenue |
97,461,093 |
135,578,062 |
151,439,335 |
|
Total expenses |
91,542,344 |
118,685,927 |
141,227,362 |
|
Gross profit |
5,918,749 |
16,892,135 |
10,211,973 |
|
Net profit |
4,222,574 |
14,202,050 |
8,529,927 |
|
Item | |||
|
Net cash flow from operations |
(2,827,274) |
4,641,399 |
(6,184,692) |
|
Net cash flow from financial activities |
4,963,717 |
(4,205,709) |
(3,941,835) |
|
Cash flow at the end of the period |
2,489,184 |
19,193,385 |
3,285,951 |
|
