
HandBook | Module 1
Table of Contents
General Introduction
The structure of TM1
Cubes
Dimensions
Rules
Processes
Chores
Applications
TM1 Perspectives Explorer
TM1 Perspectives Explorer's structure
First steps with TM1 Perspectives Explorer
Start Applix TM1 Perspectives
TM1 Menu in Excel
Menu bar and toolbar of the Server Explorer
The Menu Bar
The Toolbar
Cubes
Cube Viewer
The Menu Bar
The Tool Bar
Working with the Cube Viewer
Creating and Saving Views
Creating a Slice
Creating a Snapshot
Dimensions
Composition of dimensions
Subset Editor
The menu bar
The Tool Bar
![]()
TM1 provides the opportunity to develop and represent multidimensional data models. You work on cubes, which are composed of several (up to 256) dimensions. These cubes can be related and linked by rules and they can be created and edited by processes.
Now we will have a look at following key words:
Multidimensional
Composed of up to 256 dimensions
Contains data
Cube Viewer enables the graphical representation
Represent criteria for the analysis of the model; for example: time, region, scenario, sales, model
Components of the cubes
One dimension can be used in different cubes
Composed of single, consolidated or string elements
Elements in dimensions can be described by attributes
Subset Editor enables the graphical representation
Calculation rules
Rules for data processing in cubes
Create relations between several cubes; for example: multiplication of two cubes
Automated workflows for data processing; for example: filling cubes; creating cubes, dimensions, attributes
Tool is the Turbo Integrator
Applications help you to arrange TM1 objects in logical and work specific groups
Application-objects can be uploaded on the server or added as a reference. If a source object or file is deleted, the reference remains.
A TM1 application can contain references of every type of TM1 objects, exept for rules and replications
Every Excel file, which is referenced in a TM1 application, can be automatically made available in TM1 Web
In the following part we will learn more about the TM1 Perspectives Explorer.
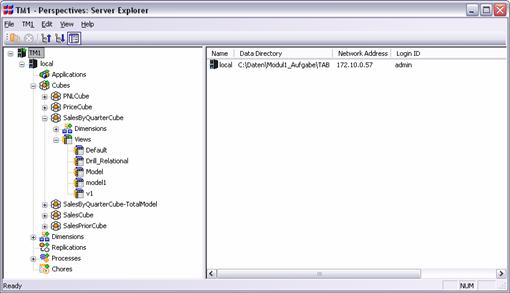
The window of the Server Explorer is divided into two sections. The section on the left hand side represents a hierarchic structure of all cubes, dimensions and processes, which are available on this server. By pressing the plus or minus button the subordinate elements can be displayed or hidden. In the window on the right (Properties Window) TM1 provides important information, such as the server you are working on, the dimensions that compose the cube and the subsets that are assigned to a dimension.
In the following part you will learn how to work with the TM1 Explorer and how to create views.
Open your Windows Start Menu and expand All Programs.
Choose Applix in your Windows Start menu and afterwards TM1. Then launch Perspectives for MS Excel. Now you should have the following view on your desktop:
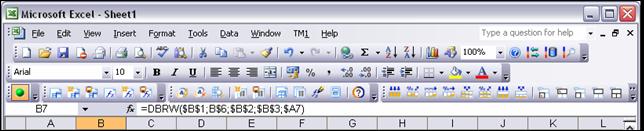
As you can see, you have an additional menu item - TM1 - in the Excel menu bar, as well as an additional toolbar. This toolbar includes many useful TM1 tools. But now let's have a look at the TM1 Menu.
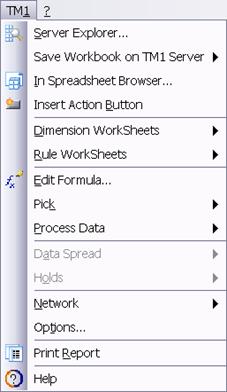
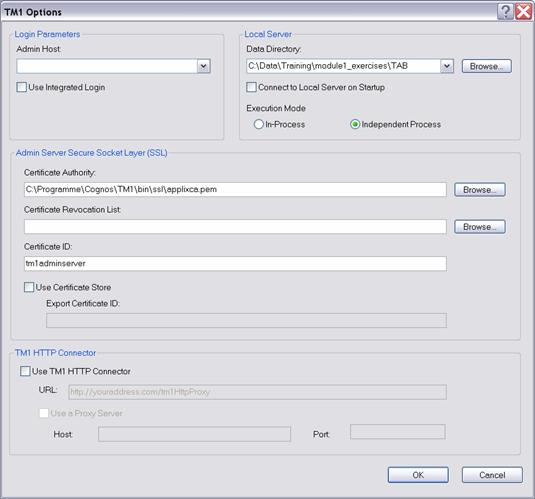
After starting TM1 Perspectives, open the TM1 Options, in order to assure that you are working on the right server. In Local Server Data Directory you can see the directory to which you are having access to right now.
If you want to print PDF Files of your reports you have the possibility to choose PostScript Printer. (9.0 or lower)
During the training the checkmark before Connect to Local Server on Start-up should remain. When you start Perspectives, a connection to the local server is established automatically.
Start TM1 as described above. After opening Excel, select Options in the TM1 Menu and make sure that you are working on the right Server Data Directory. During the training the local Server Process Execution Mode should be an independent Process. Accept the settings by pressing OK.
Now you should open the Server Explorer with TM1 Server Explorer. Then you will see the following window on your screen:
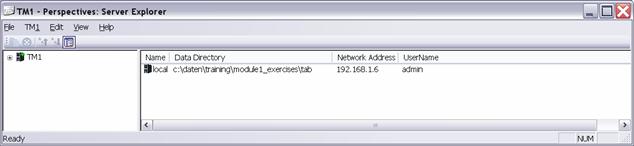
Here you have another menu bar.
On the right hand side you can see the properties window that - in case - can be hidden. You can show/hide it with View Properties Window or by pressing following buttons on the toolbar:
![]() To hide the properties window
To hide the properties window
![]() To show the properties window
To show the properties window
The other icons have following functions:
![]() Copy
Copy
![]() Delete
Delete
![]() Collapse all Children
Collapse all Children
![]() Expand all Children
Expand all Children
Now please
collapse all children and then expand all children again by the two ways shown.
Therefore you have to select a cube, where you want to open or close all subordinated
elements.
The Cube Viewer is a tool for open, configure and save views of TM1 data in cubes. The Cube Viewer includes features to print views and create slices and snapshots out of views.
Open the Cube Viewer for the Sales Cube by making a double click on Sales Cube in the left panel and the Cube Viewer window will appear with the cube's system default view.
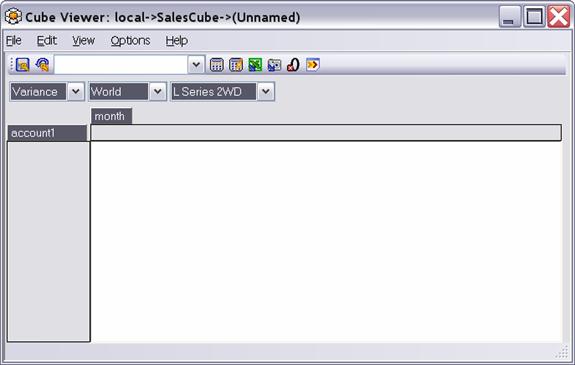
In the title bar you can see the path, so that you know in which cube you are working. At the time you can see no data. Press F9 or click the following button.
![]() Recalculate (F9)
Recalculate (F9)
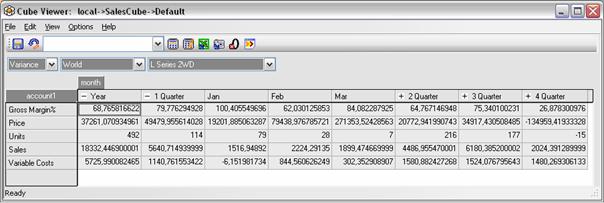
Now cell values should be displayed. Like in the TM1 Server Explorer, you can enable or suppress the display of children by pressing the plus or the minus sign. Create now following view:
The menu bar here is similar to the menu bar in TM1 Server Explorer.
![]()
A Private View is only available for the user, who created it. In contrast, Public Views are available for all users on a remote Server.
Please choose the region
Aside from the zeroes you also have these options: Format, Column Width, Expand Row header Width, Slice to new WorkBook and Classic Slice Mode.
![]() or
or ![]() Save Private or Public View
Save Private or Public View
![]() or
or ![]() Reload Private or Public View
Reload Private or Public View
![]() Choice of Views
Choice of Views
![]() Create a Slice
Create a Slice
![]() Create a Snapshot
Create a Snapshot
![]() Suppress zeroes
Suppress zeroes
![]() Layout right to the left
Layout right to the left
![]() Layout left to the right
Layout left to the right
![]() Switch on automatic recalculate
Switch on automatic recalculate
![]() Switch off automatic recalculate
Switch off automatic recalculate
The Cube Viewer has two important functions: Slices and Snapshots. They convey loaded data from a Cube into an Excel Sheet. But before you can create Slices and Snapshots you have to understand how to save and create views in the Cube Viewer.
If you open the Cube Viewer, you receive a specific View.
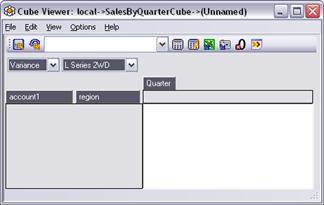
At this point we will explain how Views can be changed and saved by stacking dimensions and by choosing other elements. Close the Cube Viewer for the SalesCube and open the Cube Viewer for the SalesByQuarterCube by double-clicking on this Cube in the TM1 Server Explorer. After that the following window appears:
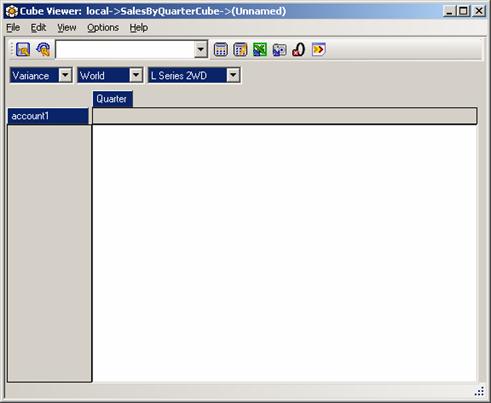
In this view you have following dimensions:
Dimensions are stackable in the Cube Viewer. Press now F9. Now values should be written in the grid. Arrange the dimensions in the following order:
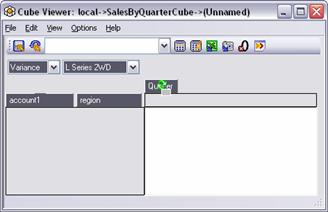
and choose following elements:
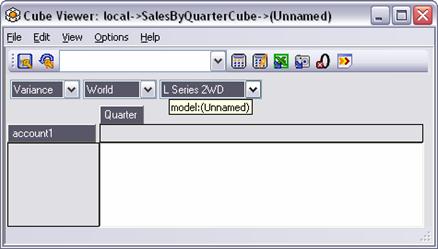
If you move the mouse pointer over a particular element you can see the name of the dimension. (see below).
![]()
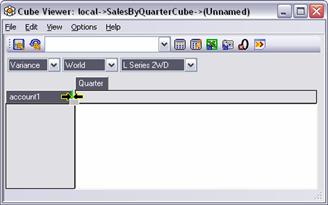
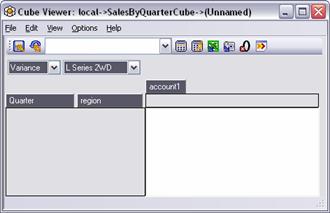
In the CubeViewer Dimensions can be moved and interchanged by Drag and Drop. Below you can see an example for moving the dimension "region" from the title dimension to the row dimension:
![]()
For interchanging dimensions, move the dimension over the dimension to replace and release:
![]()
Now build with your new abilities a view which is identical to this one.
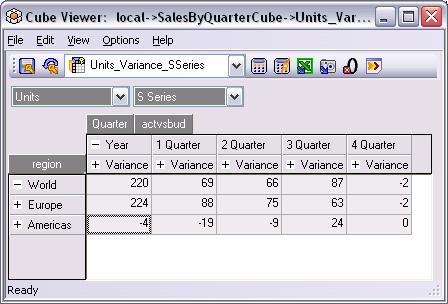
Save the view as a private view under the name: Units_Variance_SSeries. (Private views are available only to the user who created them. In contrast public views are available to all users on a remote server who have at least Read access to the associated dimensions. Only a TM1 administrator can create public views.)
For practice create another view - open the Cube Viewer for the Price Cube
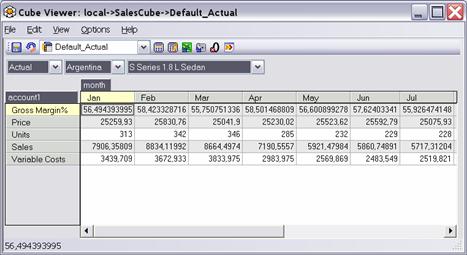
Try to create following view by yourself and save it as Actual_SSeries_Americas.
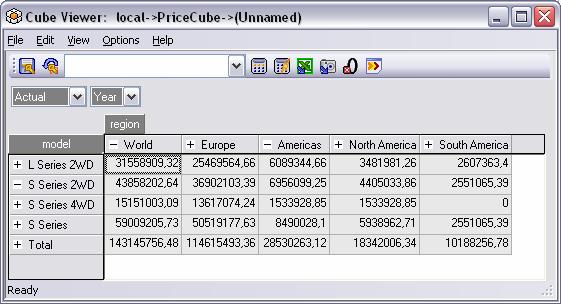
You can save this view as private or public view , whereas private view implies that only you can see and load this view.
![]() or
or ![]() Save Private or Public View
Save Private or Public View
You can use the Slice option in the Cube Viewer to copy TM1 cube views into an Excel worksheet. Create following view:
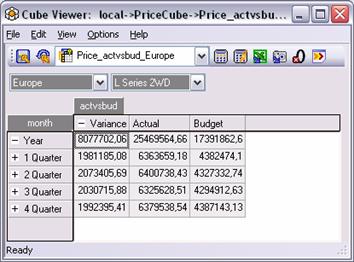
Close the Cube Viewer and open it one more time for the PriceCube The PriceCube has only four dimensions: actvsbud, region, model and month.
Press F9. The title elements are actvsbud and region, model is in the column and month in the row. Click on actvsbud and drag it to the left
in the column, drag month to the
right in the row and model to the
top behind region.
Afterwards choose
Save this view as Price_actvsbud_Europe
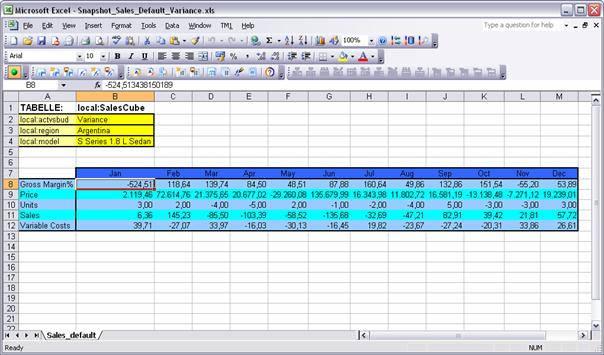
To create a slice from the Cube Viewer, choose File→Slice or press the Slice Icon. The sample view from above looks like this when it is conveyed to an Excel worksheet.
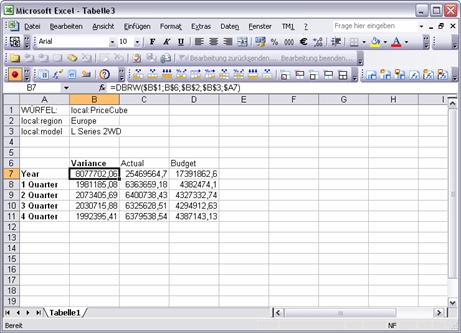
Save this Excel worksheet as Slice_ Price_actvsbud_Europe into the data directory \xls.
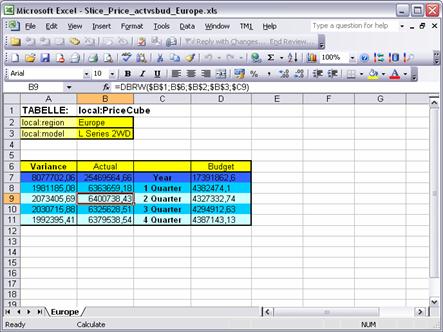
With TM1 slices you have the possibility to modify the Excel worksheets without changing the values and the functions behind the values. Select the cells A6 - A11 and cut them. Select the range E6 - E11, choose Edit→Paste. The elements that you have selected are pasted into this range. Now cut the cells B6 - C11 and paste them into A6 - B11 Afterwards cut E6 - E11 and paste this range into C6 - C11. When you now press F9, you can see that the values haven't changed. You can modify the format of the generated Excel Sheet but you will see that the functions and values stay the same. In the end you should have a similar sheet on your screen. Save the slice and close the file.
We return to the TM1 Server Explorer and open the Cube Viewer for the SalesCube. Here open the saved view Default_Variance. Then click on the icon for snapshot or File→Snapshot. The following Excel worksheet appears:
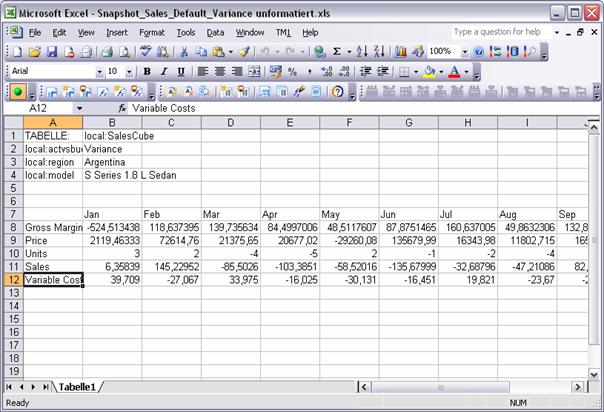
In a snapshot the data cells do not contain formulas. A snapshot differs from a slice in that it contains actual values, not functions that deliver values. Accordingly the values in a snapshot do not update when cube data changes. Save this worksheet as Snapshot_Sales_Default_Variance.
The slice and the snapshot can - in contrast to the In-Spreadsheet Browser - be printed or saved as a PDF File.
For representation of data in a multidimensional cube we first need the structure of the data model. That's why we will now explain the composition of dimensions.
Dimensions are composed of elements.
Types of Elements:
The Subset Editor is one of the most important tools for working with TM1. Here you can create, modify and save subsets.
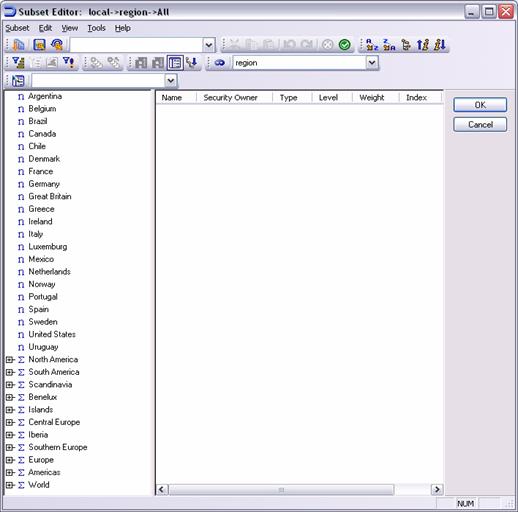
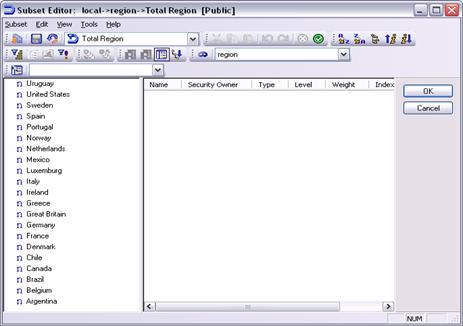
Open the TM1 Server Explorer by making a double-click on the dimension region. Then TM1 opens the Subset Editor.
The Subset
Editor is divided in two sections. The window on the left represents a
hierarchic order of all elements belonging to the dimension. The window on the
right hand side is a properties window. It gives you more information about the
properties of each selected element - for example: is it a consolidated element
or not; the weight, the
The menu bar is similar to the menu bar of the Cube Viewer.
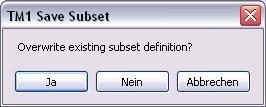
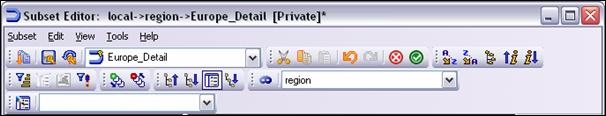
TM1 asks if you want to overwrite the existing subset definition. Please press No. Then write in the white array Europe_Detail and set a checkmark in front of private. Confirm with OK.
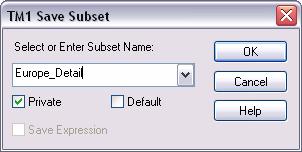
Now the title bar looks like this:
![]()
![]() Select by levels
Select by levels
Now TM1 opens this window:
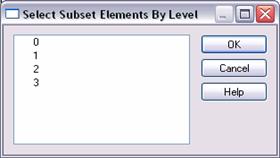
Choose 0 and confirm with OK. Now only the N-elements are displayed. These are the elements that have no subordinated elements. Click on the following icon:
![]() sort descending
sort descending
Now the following should be displayed on your screen:
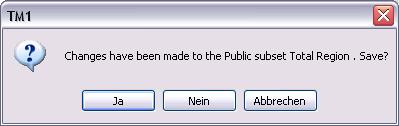
o Stop recording . choose Tools → Stop recording. This window appears:
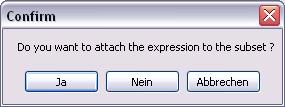
Press Yes and save the subset. Now the dynamic subset is ready. When opening the subset you can see a sign for a filter next to the name.
![]()
In the expression window, that can be displayed with View → Expression Window, the following command is written:
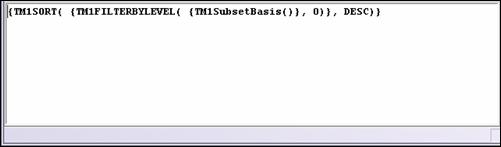
This means, that each time you open this subset a process starts. This is useful because changes in the database are considered in the subset.
o Clear Expression . here you can delete the expression that we have generated. This entails that the process does not start and so the dynamic subset becomes static.
If you want to

If you confirm with Yes, the filter-symbol next to Total Region disappears and you have transformed the dynamic subset into a static one.
o Filter. this function will be explained in Module 2.
Help . same as the Help menu in the Cube Viewer
Open the
subset Europe_Detail
that we have created previously. Click on
In the tool bar you find the same functions as in the menu point Edit.
![]() Show all elements
Show all elements
![]() or
or ![]() Save private or public subset
Save private or public subset
![]() or
or ![]() Reload public or private subset
Reload public or private subset
![]() Selection of subsets
Selection of subsets
![]() Cut
Cut
![]() Copy
Copy
![]() Insert
Insert
![]() Undo
Undo
![]() Redo
Redo
![]() Delete element
Delete element
![]() Keep element
Keep element
![]() Sort elements ascending
Sort elements ascending
![]() Sort elements descending
Sort elements descending
![]() Sort elements hierarchic
Sort elements hierarchic
![]() Sort elements by index, ascending
Sort elements by index, ascending
![]() Sort elements by index,
descending
Sort elements by index,
descending
![]() Sort elements by levels
Sort elements by levels
![]() Select by regular expression
Select by regular expression
![]() Select by attribute
Select by attribute
![]() Select by view extract
Select by view extract
![]() Drill Down
Drill Down
![]() Roll Up
Roll Up
![]() Collapse
Collapse
![]() Expand
Expand
![]() Display properties Window
Display properties Window
![]() Expand all elements
Expand all elements
![]() Switch on/off Aliases
Switch on/off Aliases
![]() Edit element formats
Edit element formats
Create now this subset with the above mentioned tools:
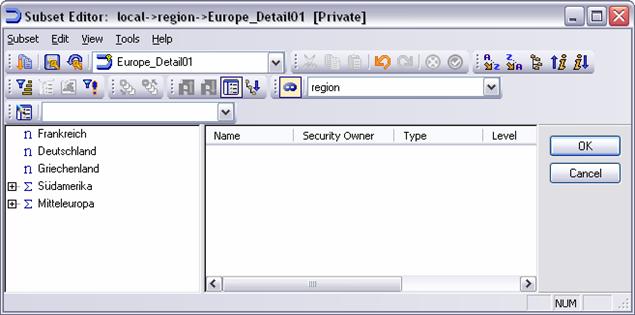
As you can see, when the aliases are switched on, the names of the states are displayed in German. Save this subset as Europe_Detail01.
Note:
In the Subset-Editor you can also choose the elements on the basis of existing lists. If you have, for example, an existing list of the countries to be selected in the form of a saved text or excel file, you can copy this list and paste it in the Subset-Editor.
|